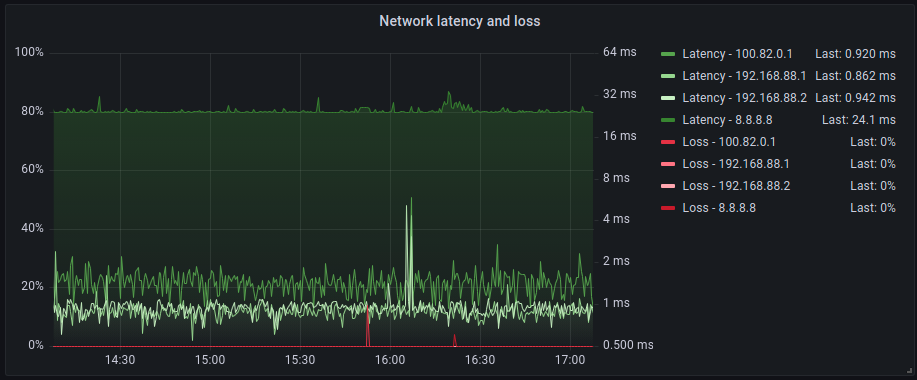
Export ping (ICMP) latency and loss data to Prometheus
Run it with docker:
$ docker run -d \
  -p 9862:9862 \
  -e 'PING_HOSTS=["1.1.1.1","8.8.8.8"]' \
  gabrielctpinheiro/ping-exporter

$ curl http://localhost:9862/metrics
Run it with docker-compose:
$ git clone https://github.com/gabriel-pinheiro/ping-exporter.git
$ cd ping-exporter
$ docker-compose up -d
$ curl http://localhost:9862/metrics
Run it with npm (Linux only):
$ git clone https://github.com/gabriel-pinheiro/ping-exporter.git
$ cd ping-exporter
$ npm install
$ npm run start:dev
$ curl http://localhost:9862/metricsYou can set the following environment variables to customize ping-exporter:
# Interface to bind the server
SERVER_HOST=0.0.0.0
# Port to listen
SERVER_PORT=9862
# Name to add to labels (used to differenciate when there are multiple instances pinging the same host)
SERVER_NAME=node01

# Hosts to monitor
PING_HOSTS=["1.1.1.1", "8.8.8.8"]
# Amount of ICMP packets to send when no loss is detected
PING_SHORT-COUNT=5
# Amount of ICMP packets to send when partial loss is detected
PING_LONG-COUNT=15
# Seconds to wait between probing the hosts (recommended: 1.5 * (PING_SHORT-COUNT + PING_LONG-COUNT) - 1)
PING_INTERVAL=29Add this item to the the scrape_configs of your prometheus.yml:
scrape_configs:
  - job_name: ping_exporter
    scrape_interval: 30s
    static_configs:
    - targets: ['PING_EXPORTER_HOST:9862']
Where PING_EXPORTER_HOST is the hostname in which ping-exporter is running.
-
Type: gauge
-
Labels:
host,name
RTT (round time trip) min, average and max latency.
Sample queries:
ping_latency_avg
ping_latency_avg{host="1.1.1.1"}
ping_latency_avg{name="node01"}
-
Type: gauge
-
Labels:
host,name
Packet loss percentage
Sample queries:
ping_loss
ping_loss{host="1.1.1.1"}
ping_loss{name="node01"}
