-
Notifications
You must be signed in to change notification settings - Fork 619
Differential Expression

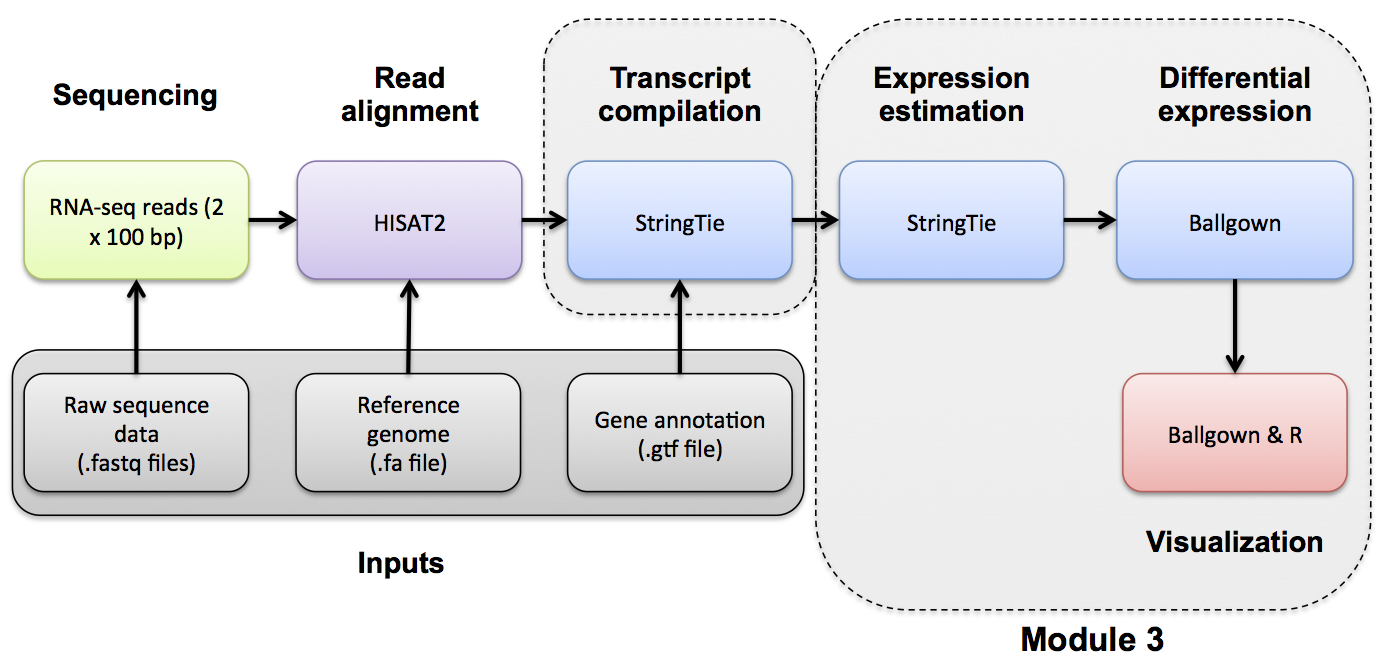
Use Ballgown to compare the tumor and normal conditions. Refer to the Ballgown manual for a more detailed explanation:
Change to ref-only directory:
mkdir -p $RNA_HOME/de/ballgown/ref_only/
cd $RNA_HOME/de/ballgown/ref_only/
Perform UHR vs. HBR comparison, using all replicates, for known (reference only mode) transcripts:
First create a file that lists our 6 expression files, then view that file, then start an R session where we will examine these results:
printf "\"ids\",\"type\",\"path\"\n\"UHR_Rep1\",\"UHR\",\"$RNA_HOME/expression/stringtie/ref_only/UHR_Rep1\"\n\"UHR_Rep2\",\"UHR\",\"$RNA_HOME/expression/stringtie/ref_only/UHR_Rep2\"\n\"UHR_Rep3\",\"UHR\",\"$RNA_HOME/expression/stringtie/ref_only/UHR_Rep3\"\n\"HBR_Rep1\",\"HBR\",\"$RNA_HOME/expression/stringtie/ref_only/HBR_Rep1\"\n\"HBR_Rep2\",\"HBR\",\"$RNA_HOME/expression/stringtie/ref_only/HBR_Rep2\"\n\"HBR_Rep3\",\"HBR\",\"$RNA_HOME/expression/stringtie/ref_only/HBR_Rep3\"\n" > UHR_vs_HBR.csv
cat UHR_vs_HBR.csv

R
A separate R tutorial file has been provided in the github repo for part 1 of the tutorial: Tutorial_Part1_ballgown.R. Run the R commands detailed in the R script.
Once you have completed the Ballgown analysis in R, exit the R session and continue with the steps below.
What does the raw output from Ballgown look like?
head UHR_vs_HBR_gene_results.tsv
How many genes are there on this chromosome?
grep -v feature UHR_vs_HBR_gene_results.tsv | wc -l
How many passed filter in UHR or HBR?
grep -v feature UHR_vs_HBR_gene_results_filtered.tsv | wc -l
How many differentially expressed genes were found on this chromosome (p-value < 0.05)?
grep -v feature UHR_vs_HBR_gene_results_sig.tsv | wc -l
Display the top 20 DE genes. Look at some of those genes in IGV - do they make sense?
grep -v feature UHR_vs_HBR_gene_results_sig.tsv | sort -rnk 3 | head -n 20 #Higher abundance in UHR
grep -v feature UHR_vs_HBR_gene_results_sig.tsv | sort -nk 3 | head -n 20 #Higher abundance in HBR
Save all genes with P<0.05 to a new file.
grep -v feature UHR_vs_HBR_gene_results_sig.tsv | cut -f 6 | sed 's/\"//g' > DE_genes.txt
head DE_genes.txt
This section will compare the observed versus expected differential expression estimates for the ERCC spike-in RNAs:
cd $RNA_HOME/de/ballgown/ref_only
wget https://raw.githubusercontent.com/griffithlab/rnaseq_tutorial/master/scripts/Tutorial_ERCC_DE.R
chmod +x Tutorial_ERCC_DE.R
./Tutorial_ERCC_DE.R $RNA_HOME/expression/htseq_counts/ERCC_Controls_Analysis.txt $RNA_HOME/de/ballgown/ref_only/UHR_vs_HBR_gene_results.tsv
View the results here:
- http://YOUR_IP_ADDRESS/rnaseq/de/ballgown/ref_only/Tutorial_ERCC_DE.pdf
In this tutorial you will:
- Make use of the raw counts you generated above using htseq-count
- edgeR is a bioconductor package designed specifically for differential expression of count-based RNA-seq data
- This is an alternative to using stringtie/ballgown to find differentially expressed genes
First, create a directory for results:
cd $RNA_HOME/
mkdir -p de/htseq_counts
cd de/htseq_counts
Create a mapping file to go from ENSG IDs (which htseq-count output) to Symbols:
perl -ne 'if ($_ =~ /gene_id\s\"(ENSG\S+)\"\;/) { $id = $1; $name = undef; if ($_ =~ /gene_name\s\"(\S+)"\;/) { $name = $1; }; }; if ($id && $name) {print "$id\t$name\n";} if ($_=~/gene_id\s\"(ERCC\S+)\"/){print "$1\t$1\n";}' $RNA_REF_GTF | sort | uniq > ENSG_ID2Name.txt
head ENSG_ID2Name.txt
Determine the number of unique Ensembl Gene IDs and symbols. What does this tell you?
cut -f 1 ENSG_ID2Name.txt | sort | uniq | wc
cut -f 2 ENSG_ID2Name.txt | sort | uniq | wc
cut -f 2 ENSG_ID2Name.txt | sort | uniq -c | sort -r | head
Launch R:
R
A separate R tutorial file has been provided in the github repo for part 4 of the tutorial: Tutorial_edgeR.R. Run the R commands in this file.
Once you have run the edgeR tutorial, compare the sigDE genes to those saved earlier from cuffdiff:
cat $RNA_HOME/de/ballgown/ref_only/DE_genes.txt
cat $RNA_HOME/de/htseq_counts/DE_genes.txt
Pull out the gene IDs
cd $RNA_HOME/de/

cut -f 1 $RNA_HOME/de/ballgown/ref_only/DE_genes.txt | sort  > ballgown_DE_gene_symbols.txt
cut -f 2 $RNA_HOME/de/htseq_counts/DE_genes.txt | sort > htseq_counts_edgeR_DE_gene_symbols.txt
Visualize overlap with a venn diagram. This can be done with simple web tools like:
To get the two gene lists you could use cat to print out each list in your terminal and then copy/paste.
Alternatively you could view both lists in a web browser as you have done with other files. These two files should be here:
http://YOUR_IP_ADDRESS/rnaseq/de/ballgown_DE_gene_symbols.txt http://YOUR_IP_ADDRESS/rnaseq/de/htseq_counts_edgeR_DE_gene_symbols.txt
| Previous Section | This Section | Next Section |
|---|---|---|
| Expression | Differential Expression | DE Visualization |
NOTICE: This resource has been moved to rnabio.org. The version here will be maintained for legacy use only. All future development and maintenance will occur only at rnabio.org. Please proceed to rnabio.org for the current version of this course.
Table of Contents
Module 0: Authors | Citation | Syntax | Intro to AWS | Log into AWS | Unix | Environment | Resources
Module 1: Installation | Reference Genomes | Annotations | Indexing | Data | Data QC
Module 2: Adapter Trim | Alignment | IGV | Alignment Visualization | Alignment QC
Module 3: Expression | Differential Expression | DE Visualization
Module 4: Alignment Free - Kallisto
Module 5: Ref Guided | De novo | Merging | Differential Splicing | Splicing Visualization
Module 6: Trinity
Module 7: Trinotate
Appendix: Saving Results | Abbreviations | Lectures | Practical Exercise Solutions | Integrated Assignment | Proposed Improvements | AWS Setup