This is a python implementation of the tensorflow playground online demo using tensorflow's python module. While the implementation is tried to be as close as possible to the online demo, you may find subtle differences between the outcomes of the two.
We have used this implementation to try parameter space exploration in five different scenarios. For each scenario we have created many random configurations of the netural network by picking random values for each of the hyper parameters. For each neural network configuration, we training and tested the network and recorded statistics about the results at different epochs. In one scenario (full), we have randomized all parameters, including the input data shape and noise. For other four scenarios (circle, xor, gauss, spiral), we kept the data shape and noise fixed, and randomized all the other parameters.
| _ | data | Download Link | Example | Description |
|---|---|---|---|---|
 |
full | full.zip (3.2G) | tiny version (200 rows) | random shapes and noises. 100,000 records |
 |
circle_25 | circle_25.zip (330M) | tiny version (50 rows) | circle with 25% noise. 10,000 records |
 |
gauss_25 | gauss_25.zip (346M) | tiny version (50 rows) | gauss with 25% noise. 10,000 records |
 |
xor_25 | xor_25.zip (371M) | tiny version (50 rows) | xor with 25% noise. 10,000 records |
 |
spiral_25 | spiral_25.zip (312 MB) | tiny version (50 rows) | spiral with 25% noise. 10,000 records |
This file contains the summarized stats for the parameter space analysis. Each row corresponds to one random combination of hyper parameter values at a particular epoch.
| field | type | description |
|---|---|---|
| ID | output: integer | row unique id |
| imagePath | output: string | output image path |
| data | input: string: {circle, gauss, xor, spiral} | dataset shape |
| noise | input: int: [0 .. 50] | data noise percent: 0 to 50 |
| training_ratio | input: int: [10 .. 90] | ratio of training to test data |
| batch_size | input: int: [1 .. 30] | training batch size |
| X1 | input: int: {0, 1} | 1 if X1 feature is an input to the network, 0 otherwise |
| X2 | input: int: {0, 1} | 1 if X2 feature is an input to the network, 0 otherwise |
| X1Squared | input: int: {0, 1} | 1 if X12 feature is an input to the network, 0 otherwise |
| X2Squared | input: int: {0, 1} | 1 if X22 feature is an input to the network, 0 otherwise |
| X1X2 | input: int: {0, 1} | 1 if X1X2 feature is an input to the network, 0 otherwise |
| sinX1 | input: int: {0, 1} | 1 if sin(X1) feature is an input to the network, 0 otherwise |
| sinX2 | input: int: {0, 1} | 1 if sin(X2) feature is an input to the network, 0 otherwise |
| layer_count | input: int:[0 .. 6] | number of hidden layers |
| neuron_count | input: int | sum of neurons in all hidden layers |
| H1 | input: int: [0 .. 8] | number of neurons in hidden layer 1 |
| H2 | input: int: [0 .. 8] | number of neurons in hidden layer 2 |
| H3 | input: int: [0 .. 8] | number of neurons in hidden layer 3 |
| H4 | input: int: [0 .. 8] | number of neurons in hidden layer 4 |
| H5 | input: int: [0 .. 8] | number of neurons in hidden layer 5 |
| H6 | input: int: [0 .. 8] | number of neurons in hidden layer 6 |
| learning_rate | input: float | learning rate |
| activation | input: string: {ReLU, Tanh, Sigmoid, Linear} | activation function for hidden layers |
| regularization | input: string: {None, L1, L2} | regularization type |
| regularization_rate | input: float | regularization rate |
| epoch | output: int: {25, 50, 100, 200, 400} | epoch for which the stats were generated |
| iteration | output: int | iteration (step) for which the stats were generated |
| total_time | output: float | total time (ms) at this epoch |
| mean_time | output: float | mean time (ms) per epoch |
| train_loss | output: float | training loss |
| test_loss | output: float | test loss |
| train_TPR | output: float | True Positive Rate (rate of +1 points correctly classified) on training data |
| train_FPR | output: float | False Positive Rate (rate of -1 points incorrectly classified as +1) on training data |
| test_TPR | output: float | True Positive Rate (rate of +1 points correctly classified) on test data |
| test_FPR | output: float | False Positive Rate (rate of -1 points incorrectly classified as +1) on test data |
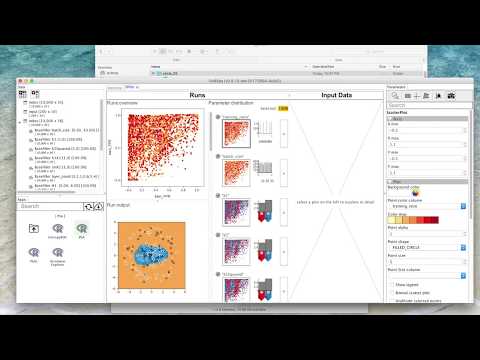
The video below demonstrates and example analysis using the VisR framework.
Note: The parameter explorer app cannot currently load tables much larger than 10,000 rows due to memory limitation. You may use it on circle_25, xor_25, gauss_25 or spiral_25 datasets, but the parameter explorer app will not work on the full dataset (100,000 rows).