This repo hosts the default plan visualization component liberated from the VS Code extension for PDDL.
This sample shows the single-plan viewer and multi-plan viewer side by side:
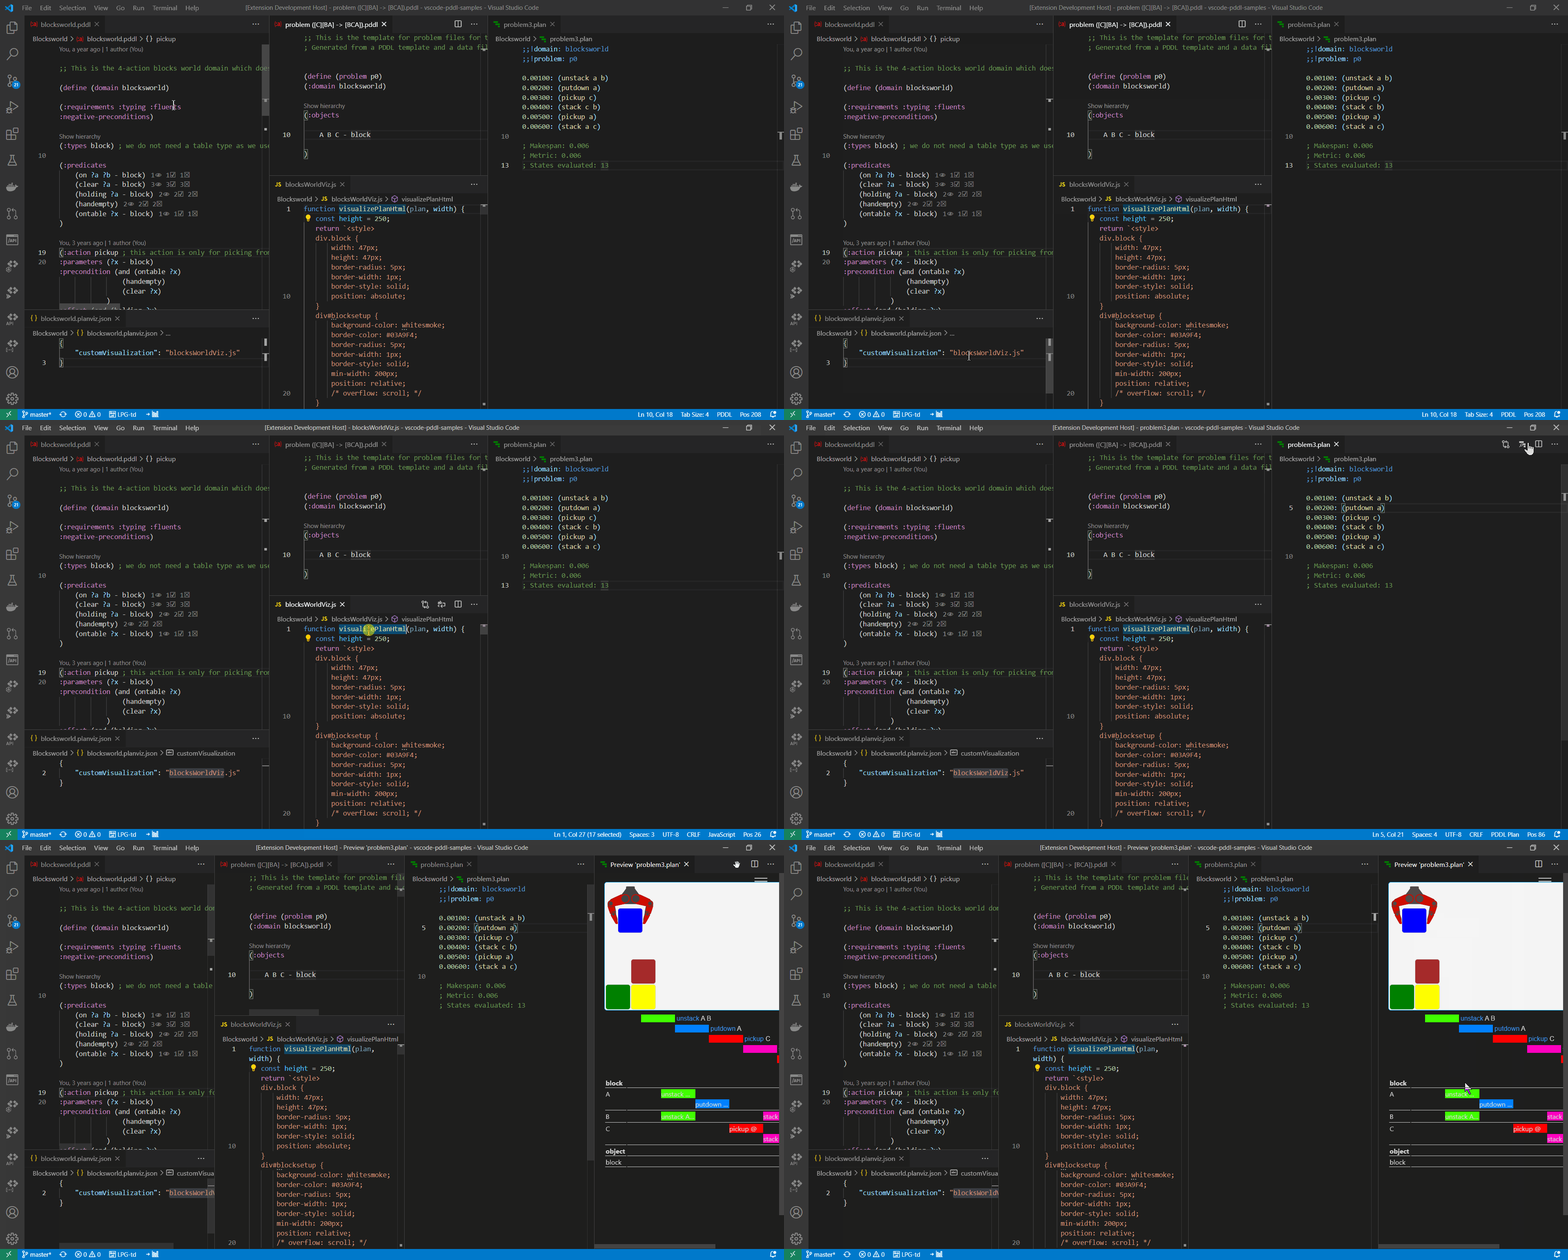
Here is how it looks when integrated into VS Code:
To study the files used in the above example, see blocksworld.planviz.json and blocksWorldViz.js.
The sample built into this repo is using Browserify with the Tsify plugin to build the component from the developer comfort of Typescript with support of NPM packaging. It may be possible to use it from plain HTML+Javascript context.
<script defer src="../out-sample/sample.js"></script>
<div id="plan"></div>
See the full sample.html.
const planView = createPlanView("plan", {
        disableSwimlanes: false,
        displayWidth: 600,
        epsilon: 1e-3,
        onActionSelected: actionName => console.log('Selected: ' + actionName)
    });

const planInfo = new parser.PddlPlanParser().parseText(planText, 1e-3);

planView.showPlan(planInfo.getPlan());Some PDDL domain models include actions that have no meaning in the
real world (e.g. temporal clips) and are undesirable in the visual
plan representation. They may be removed by specifying their names or regex pattern(s) in the excludeActions and passing it via the optional visualization configuration:
const configuration = new JsonDomainVizConfiguration({
    "excludeActions": [
        "action-to-be-hidden",
        "^prefix_",
        "suffix$"
    ],
    "ignoreActionParameters": [
        {
            "action": "^move",
            "parameterPattern": "^(to|from)$"
        }
    ],
});


planView.showPlan(plan, configuration);
The example also shows how the ignoreActionParameters option may be used to hide actions from the object swim-lane diagrams.
This is useful, when some actions have parameters for implementation reasons, but should not be visualized.
todo: distinguish between state and plan visualization
Javascript code may be used to insert a custom plan visualization on top
of the Gantt chart. Here is an example of the visualizeHtml function,
which generates HTML text that ends up being plugged into the the designated
host HTMLElement.innerHTML property.
function visualizeHtml(plan, width) {
    const height = 100;
    return `<svg height="${height}" width="${width}">
        <rect width="${width}" height="${height}" style="fill:rgb(0,0,255);stroke-width:3;stroke:rgb(0,0,0)" />
        <circle cx="${height/2}" cy="${height/2}" r="${plan.metric}" stroke="black" stroke-width="3" fill="red" />
      </svg>`;
}
module.exports = {
    // define one of the following functions:
    visualizePlanHtml: visualizeHtml,
    visualizePlanInDiv: undefined, // function (hostDiv, plan, width)
    visualizePlanSvg: undefined // function (plan, width)
};
If the final state of the plan is more appropriate for visualization (as oppose to the plan itself), the visualization logic may look this way:
/**
 * Populates the `planVizDiv` element with the plan visualization of the `finalState`.
 * @param {HTMLDivElement} planVizDiv host element on the page
 * @param {Plan} plan plan to be visualized
 * @param {{variableName: string, value: number | boolean}[]} finalState final state of the `plan`
 * @param {number} displayWidth desired width in pixels
 */
function visualizeStateInDiv(planVizDiv, plan, finalState, displayWidth) {
  console.log(finalState);
  for (const v of finalState) {
    console.log(`${v.variableName}: ${v.value}`);
  }
}

module.exports = {
   visualizeStateInDiv: visualizeStateInDiv
};
The above example merely prints the final state values to the browser console.
Note that the finalState is requested by the PlanView using the onFinalStateVisible event and
the PlanView.showFinalState(finalState: VariableValue[]) callback.
The finalState values can be calculated using the PlanEvaluator from the ai-planning-val.js package.
The detailed visualization function signatures may be seen in CustomVisualization.ts.
The custom visualization script is passed to the component via the second optional showPlan() argument.
const customVisualizationJavascriptText = `
function myCustomVisualization(plan, width) {
    ...
}
module.exports = {
    visualizeHtml: myCustomVisualization,
}
`;

const configuration = new JsonDomainVizConfiguration({
    "excludeActions": [
        "action-to-be-hidden",
        "^prefix_",
        "suffix$"
    ],
    "ignoreActionParameters": [
        {
            "action": "^move",
            "parameterPattern": "^(to|from)$"
        }
    ],
    "customVisualization": "disregarded-path-in-this-use-case"
}, () => customVisualizationJavascriptText);


planView.showPlan(plan, configuration);To compile the component, run npm run compile.
To compile the sample, run npm run compileSample. Once it is compiled, run the sample by simply opening sample.html in a browser.
In VS Code just press F5.


