Uber Eats is an online food ordering and delivery platform. It is a subsidiary of Uber Technologies, the same company known for its ride-hailing service. Uber Eats allows users to browse menus, place orders, and have food delivered from a wide range of restaurants and food establishments in their area. The Uber Eats platform operates through a mobile application and a website. Users can download the app on their smartphones or access the service through the website. Once logged in, users can enter their delivery address to view a list of participating restaurants nearby.
Users can browse through various menus, select items they want to order, customize their meals if applicable, and add them to their virtual cart. The app also provides total cost of the order, including taxes, fees, and delivery charges. When the order is placed, it is transmitted to the restaurant. The restaurant then prepares the food and hands it over to an Uber Eats driver for delivery. Uber Eats drivers, often referred to as "delivery partners," use their own vehicles to pick up the food and deliver it to the customer's location.
Throughout the process, users can track the progress of their order within the app, including when it's being prepared, when the driver is en route, and when it's delivered. Payment for the order is typically done through the app, using a credit card or other payment methods available in the user's account.
Food Delivery services like Uber need to show the time it will take to deliver the order to keep transparency with their customers. Showing accurate delivery times is crucial for Uber Eats because:
-
Customer Expectations: In today's fast-paced world, customers have come to expect convenience and efficiency when it comes to food delivery. Providing accurate delivery time estimates helps manage customer expectations and ensures they are aware of when their order will arrive. It enhances transparency and helps build trust between the platform and the customer.
-
Customer Satisfaction: Delivery time accuracy directly impacts customer satisfaction. If a delivery is consistently delayed or arrives much later than anticipated, it can lead to frustration and dissatisfaction. On the other hand, if the estimated delivery time is reliable and the order arrives promptly, it enhances the overall customer experience and increases the likelihood of repeat business.
-
Time Management: Accurate delivery time predictions enable customers to plan their day effectively. By knowing when their order will arrive, they can schedule their activities accordingly, whether it's waiting at home or stepping out briefly. This feature is particularly important for busy individuals who have limited time and need to manage their daily routines efficiently.
-
Operational Efficiency: Reliable delivery time predictions allow delivery platforms to optimize their operations. By accurately estimating delivery times, they can manage their fleet of delivery partners more effectively, assign orders based on distance and estimated delivery time, and streamline the entire delivery process. This can lead to improved efficiency, reduced idle time, and better resource allocation.
-
Reputation and Competition: Delivery platforms operate in a highly competitive market, and accurate delivery time predictions contribute to their overall reputation. When customers consistently receive their orders within the estimated time frame, it enhances the platform's reliability and positive word-of-mouth, which can attract new customers and retain existing ones.
-
Customer Retention: Timely delivery is crucial for customer retention. When customers have a positive experience with on-time deliveries, they are more likely to continue using the service and recommend it to others. On the other hand, frequent delays or unreliable delivery times can drive customers away, leading to a loss of business.
Accurate delivery time predictions are vital for services like Uber Eats to manage customer expectations, enhance customer satisfaction, optimize operations, build a positive reputation, and ultimately retain and attract customers. By leveraging data science and advanced analytics, these platforms can improve their prediction capabilities, leading to a more reliable and enjoyable food delivery experience for customers.
To accurately predict food delivery times in real-time, several factors need to be taken into account. One crucial aspect is calculating the distance between the food preparation point (usually a restaurant) and the point of food consumption (the delivery location). By determining the geographical separation, we gain a fundamental parameter for estimating the delivery duration.
In addition to distance, it is essential to consider historical data on delivery times for similar distances. This information allows us to identify and establish relationships between the time taken by delivery partners in the past and the corresponding delivery distances. Analyzing this data enables us to uncover patterns, trends, and dependencies that can help us make accurate predictions about future delivery durations.
By leveraging machine learning algorithms and statistical techniques, we can build a predictive model that takes into account not only the distance but also various other factors that can impact delivery times. These factors may include traffic conditions, time of day, day of the week, weather conditions, and even the current workload of delivery partners. By incorporating these variables into our model, we can create a more comprehensive and accurate estimation of the food delivery time.
Moreover, the model can be continuously improved and updated as new data becomes available. By regularly updating the model with the latest delivery data, we can ensure that it remains relevant and reflective of changing conditions and trends in the delivery process.
It is worth noting that real-time delivery time prediction requires a dynamic and responsive system. As new orders come in and delivery partners are assigned, the model needs to recalculate and adjust the estimated delivery times based on the current circumstances. This ensures that customers receive up-to-date and reliable information about when they can expect their food to arrive.
| Column | Description | Dtype |
|---|---|---|
| ID | order ID number | object |
| Delivery_person_ID | ID number of the delivery partner | object |
| Delivery_person_Age | Age of the delivery partner | object |
| Delivery_person_Ratings | Ratings of the delivery partner based on past deliveries | object |
| Restaurant_latitude | The latitude of the restaurant | float64 |
| Restaurant_longitude | The longitude of the restaurant | float64 |
| Delivery_location_latitude | The latitude of the delivery location | float64 |
| Delivery_location_longitude | The longitude of the delivery location | float64 |
| Order_Date | Date of the order | object |
| Time_Orderd | Time the order was placed | object |
| Time_Order_picked | Time the order was picked | object |
| Weatherconditions | Weather conditions of the day | object |
| Road_traffic_density | Density of the traffic | object |
| Vehicle_condition | Condition of the vehicle | int64 |
| Type_of_order | The type of meal ordered by the customer | object |
| Type_of_vehicle | The type of vehicle delivery partner rides | object |
| multiple_deliveries | Amount of deliveries driver picked | object |
| Festival | If there was a Festival or no. | object |
| City | Type of city | object |
| Time_taken(min) | The time taken by the delivery partner to complete the order | object |
The main objective of the project was to develop an efficient prediction model for estimating the time taken (in minutes) for order delivery, utilizing a combination of various features as predictors. To achieve this, the project involved applying different transformation techniques, performing feature engineering, and conducting feature selection processes. These steps were undertaken with the purpose of uncovering hidden patterns and correlations among the features.
By leveraging these discovered relationships, the aim was to create a robust prediction model capable of accurately estimating the delivery time for each specific order. The project sought to go beyond simple data analysis and explore the underlying factors that contribute to the delivery time, thereby enabling more precise predictions and enhancing overall operational efficiency.
The entire process of addressing the problem and working towards a solution was meticulously documented in a series of notebooks. Each notebook represented a distinct stage of the project, capturing the step-by-step approach taken to analyze, transform, engineer, and select features for the prediction model.
- 1.0-business-case.ipynb
- 2.0-acquire-and-cleanse-data.ipynb
- 3.0-analyze-and-explore-data.ipynb
- 4.0-machine-learning-modeling.ipynb
- 5.0-solving-steps-and-final-solution.ipynb
These notebooks served as comprehensive records of the methodologies employed, including any data preprocessing techniques applied, feature transformation methods utilized, and feature engineering strategies implemented.
Additionally, the notebooks documented the specific algorithms, models, or techniques used for prediction. This documentation not only facilitated transparency and reproducibility but also provided a valuable resource for future reference, allowing for easy sharing of insights, methodologies, and findings with colleagues and stakeholders. By maintaining a systematic record of the entire project within the notebooks, it ensured a thorough understanding of the process and laid the foundation for future improvements and iterations.
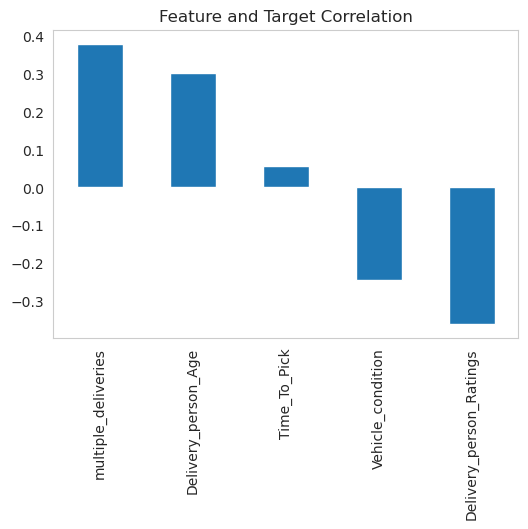
From the very beginning of the project, it became evident that there existed a remarkably strong correlation between two specific features and the target: "multiple_deliveries" and "person_rating."
This correlation held significant potential for further exploration and analysis in subsequent stages of the project. The relationship between these two features presented an intriguing avenue for gaining valuable insights.
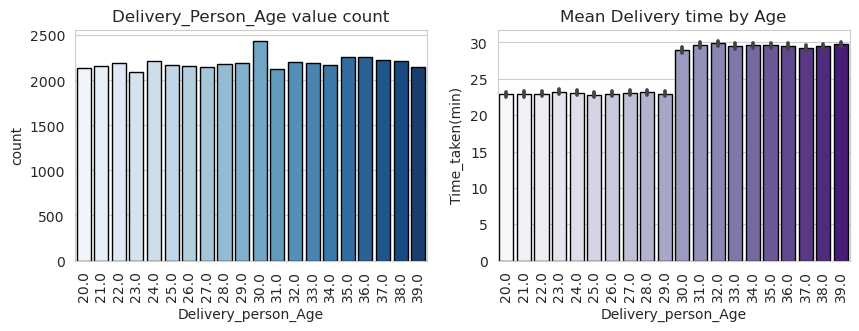
The distribution of ages among the delivery personnel does not exhibit a discernible pattern, as each age group appears to have a roughly equal representation of around 2000 individuals. The age range spans from 20 to 39 years.
However, despite the lack of a clear distribution pattern, an interesting observation emerges regarding the delivery times of the personnel based on age. It is noted that delivery personnel older than 30 tend to have higher delivery times compared to their younger counterparts. This suggests that age, despite not displaying a distinct distribution, serves as a useful threshold for distinguishing between delivery personnel with different delivery time characteristics.
Specifically, the mean delivery time for delivery personnel younger than 30 is approximately 22 minutes, whereas it increases to around 29 minutes for those older than 30. This age-based distinction in delivery times suggests that older delivery personnel consistently take longer to complete deliveries compared to their younger counterparts.
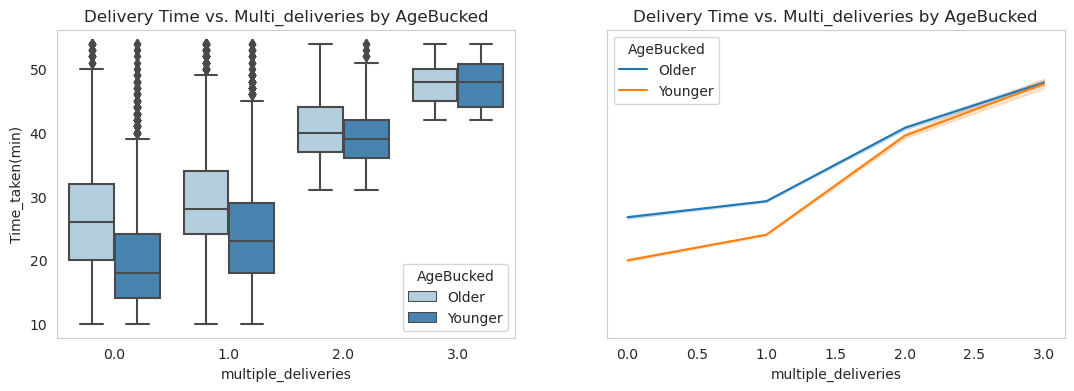
Furthermore, it is observed that the delivery times of younger delivery personnel exhibit a larger number of outliers, indicating greater variability in their delivery performance. In contrast, older delivery personnel have fewer outliers, implying that higher delivery times among the older age group are relatively more common and less unexpected.
The tendency for older delivery personnel to take longer delivery times can potentially be attributed to their higher workload. It is noted that older delivery personnel typically handle more deliveries compared to their younger counterparts. This observation suggests that the increased number of deliveries undertaken by older individuals might contribute to their longer delivery times.
Apart from the impact of multiple deliveries, the statistical characteristics of the data remain largely similar across all the numerical variables. This suggests that, aside from the influence of multiple deliveries, other numerical variables do not exhibit substantial variations or distinguishable patterns among the delivery personnel.
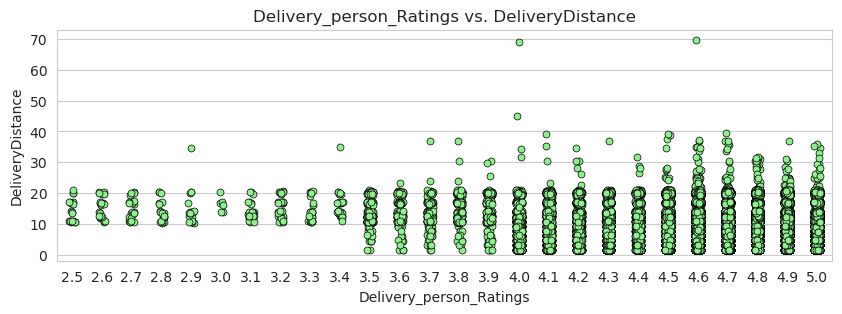
The analysis of driver ratings reveals several noteworthy findings. The vast majority of drivers have ratings higher than 4.0, indicating that the overall quality of drivers is generally quite high.
The range of ratings spans from 2.5 to 5.0, with a mean rating of 4.7. This suggests that the average driver is highly rated by customers, indicating a positive perception of their service quality.
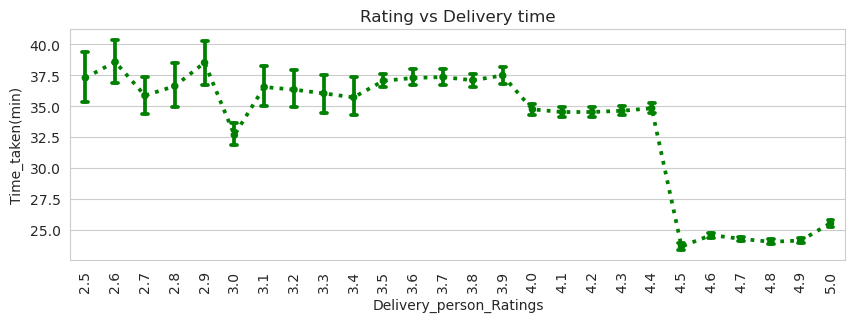
A clear relationship emerges between driver ratings and delivery times. Lower ratings are associated with slower delivery times. Specifically, delivery personnel with ratings below 4.5 have an average delivery time of 35 minutes, while those with ratings higher than 4.5 have an average delivery time of around 24 minutes. This correlation indicates that drivers with higher ratings tend to deliver orders more efficiently.
Furthermore, it is important to note that there is a scarcity of drivers with ratings below 3.5. Less than 200 drivers fall into this category, which constitutes less than 0.004% of the total population. This scarcity implies that the impact of low-rated drivers on the overall model performance may be less significant than initially anticipated.
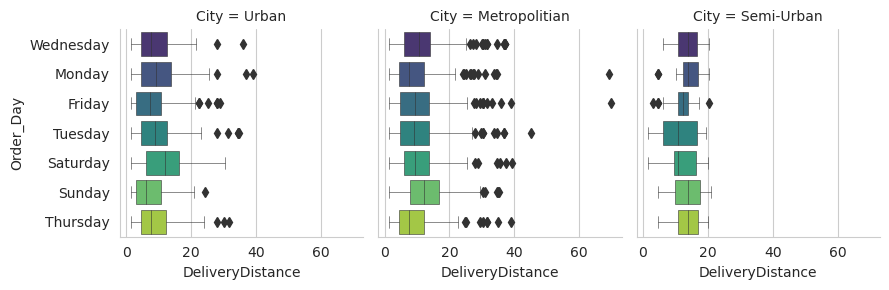
In order to analyze the distances between coordinates, the haversine formula was employed. This formula allowed for the calculation of accurate distances, taking into account the curvature of the Earth. During the analysis, outliers in the delivery distance data were identified and treated as missing values. These outliers were likely a result of errors in the formula or potential usage of a VPN, leading to inaccurate distance measurements.
By replacing the outliers with the mean distance by delivery time, the standard deviation was reduced, and the mean and median became more comparable. This adjustment helped in achieving a more representative measure of central tendency.
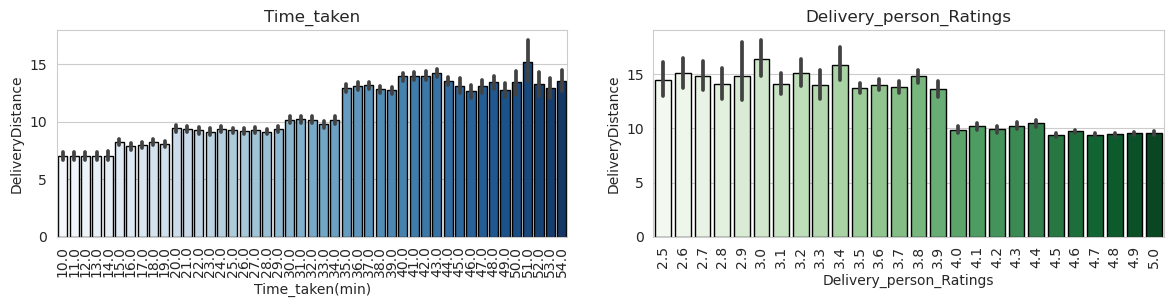
Interestingly, as the time taken for delivery increased, the average distance traveled also tended to increase. This correlation suggests that longer distances may contribute to longer delivery times.
Most of the delivery distances fell within the range of 1 to 20 km, indicating that this was the typical distance range for most deliveries.
There was an observed relationship between high-rated delivery personnel and shorter delivery distances. This suggests that higher-rated drivers tend to handle deliveries that are relatively closer in proximity.
Semi-urban deliveries, on average, took around 45 minutes or longer. This finding indicates that delivery times for semi-urban areas were generally higher compared to other locations, potentially due to factors such as traffic congestion or greater distance to the destination.
A notable trend observed in the data is that the majority of orders are placed during late-night hours. This suggests that late-night orders are quite common among customers.
Furthermore, it was found that early orders generally have shorter delivery times compared to late-night orders. This indicates that deliveries made during the early hours are typically completed more quickly, possibly due to lower overall demand or reduced traffic congestion during those times.
Interestingly, it was observed that multiple deliveries, specifically those involving three deliveries, only occur after 10 am. This suggests that the occurrence of multiple deliveries is more common during daytime hours, potentially indicating higher demand or a busier delivery schedule during that time period.
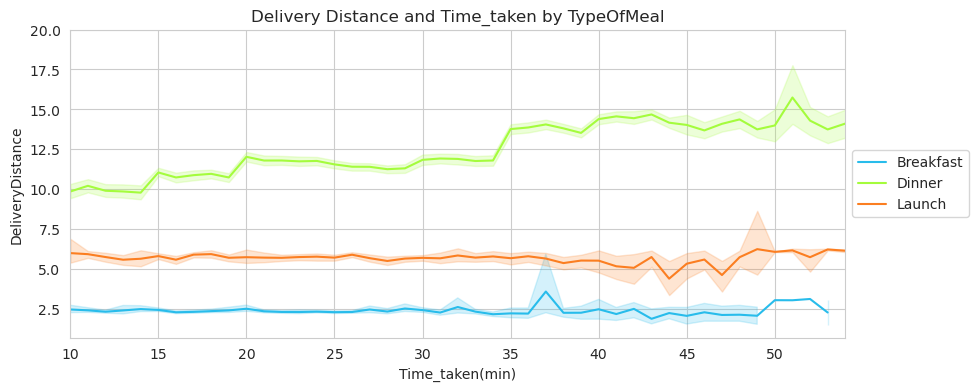
When considering the delivery distance based on meal type, it was found that the distance traveled for breakfast and lunch orders is generally lower compared to dinner orders. This disparity could be attributed to various factors, such as different customer preferences, the availability of nearby breakfast and lunch options, or the nature of dinner orders being more inclined towards delivery from distant locations.
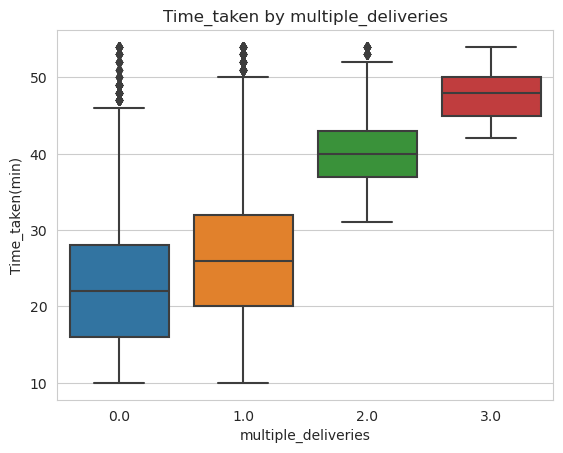
The analysis reveals that the majority of delivery personnel were carrying either one or two orders during their deliveries. This suggests that single or double order deliveries are most common among the delivery workforce.
On average, it was found that an increase in multiple deliveries is associated with an increase in the total distance traveled by the delivery personnel. This finding implies that handling multiple deliveries often requires covering more ground, resulting in longer overall distances.
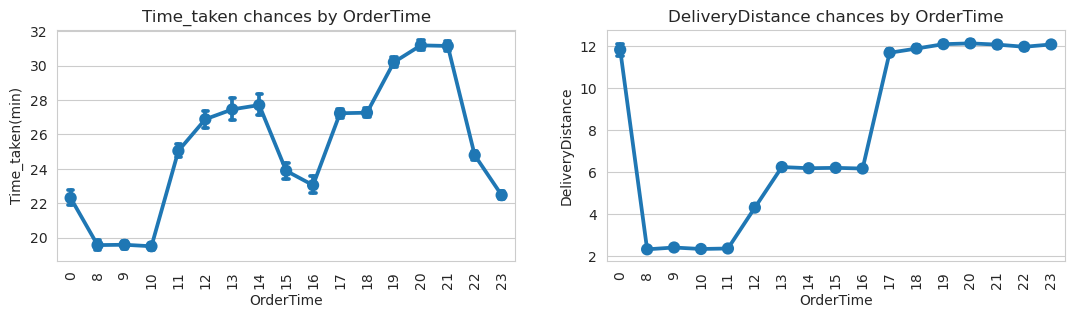
The analysis indicates that a significant number of people tend to place their orders during late-night hours. This suggests a notable demand for delivery services during this time period.
Furthermore, there is a clear relationship between the timing of orders and the corresponding delivery times. Early orders generally have shorter delivery times compared to late-night orders, implying that deliveries made during the early hours are typically completed more quickly. This could be attributed to factors such as lower overall demand, less traffic congestion, or more efficient operations during the early hours.
On the other hand, late-night orders tend to have longer delivery times. This could be due to various factors, including increased demand during those hours, potential staff shortages, or a higher volume of orders to be processed.
The observed pattern of early orders having shorter delivery times and late-night orders having longer delivery times highlights the importance of considering the time of order placement when managing delivery operations. It can help businesses allocate resources effectively, adjust staffing levels, and optimize delivery routes to meet the expected demand during different time periods.
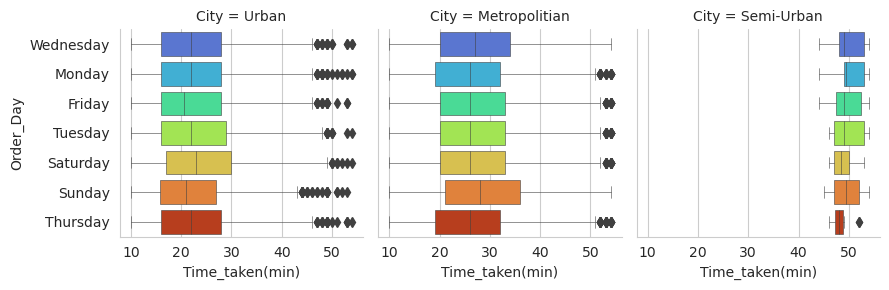
The analysis reveals that Friday and Wednesday are the days with the highest number of orders, indicating a greater demand for delivery services on these days. However, delivery times vary across different days of the week.
It was found that Wednesday orders tend to take longer to be delivered compared to other days, suggesting potential factors such as higher order volumes, increased traffic congestion, or operational challenges specific to Wednesdays.
In contrast, Tuesday and Thursday are the days when deliveries are made faster, with shorter average delivery times observed. This could be attributed to factors such as lower order volumes, more efficient operations, or favorable traffic conditions on these particular weekdays.
Interestingly, while there are variations in delivery times across different days, the day of the week does not seem to be a decisive factor in determining delivery times. Other factors, such as order volume, traffic conditions, or operational efficiency, may have a stronger influence.
In order to solve the problem, I chose to use a Sequential Neural Network (NN) implemented with the Keras framework. The Sequential NN is a type of neural network architecture that consists of a linear stack of layers, with the output of each layer serving as the input to the next layer.
By using a Sequential NN, I aimed to leverage its ability to learn complex patterns and relationships between the input features and the target variable (time_taken). The sequential nature of the network allowed for the efficient modeling of the sequential data present in the problem.
I implemented the Sequential NN using the Keras framework, which provided several advantages. Keras offered a user-friendly interface for constructing neural networks, enabling faster experimentation and iteration. It also provided a wide range of pre-built layers and optimization algorithms, simplifying the process of designing and training the model.
By training the Sequential NN on the available data, I was able to leverage the hidden patterns and correlations between the features to make accurate predictions of the delivery time for a given order. This approach allowed for the utilization of advanced techniques such as backpropagation and gradient descent to optimize the network's weights and biases, improving its predictive capabilities.
model = Sequential()

model.add(Dense(27, activation = 'relu'))
model.add(Dense(13, activation = 'relu'))
model.add(Dense(6, activation = 'relu'))
model.add(Dense(1))

model.compile(optimizer = 'adam', loss = 'mean_squared_error')
| MSE | RMSE | MAE | Explained Variance | Max Error |
|---|---|---|---|---|
| 19.198 | 4.381 | 3.504 | 0.789 | 25.0 |
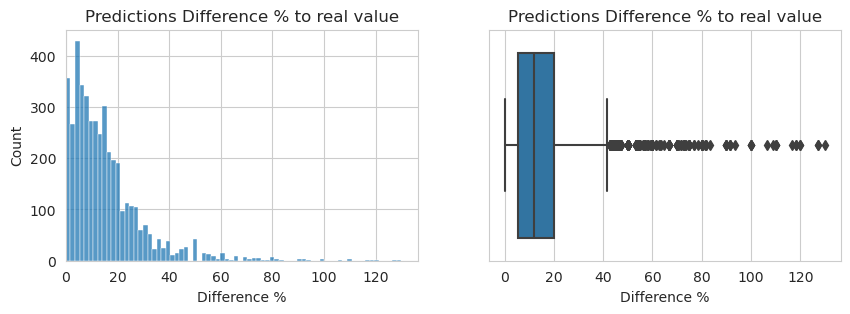
| Real Value | Model Prediction | Difference | Difference % | |
|---|---|---|---|---|
| mean | 26.23 | 26.89 | -0.65 | 15.41 |
| std | 9.47 | 8.31 | 4.34 | 14.93 |
| min | 10.00 | 12.00 | -16.00 | 0.00 |
| 25% | 19.00 | 21.00 | -4.00 | 5.55 |
| 50% | 25.00 | 25.00 | -1.00 | 11.76 |
| 75% | 32.00 | 32.00 | 2.00 | 20.00 |
| max | 54.00 | 59.00 | 25.00 | 130.00 |
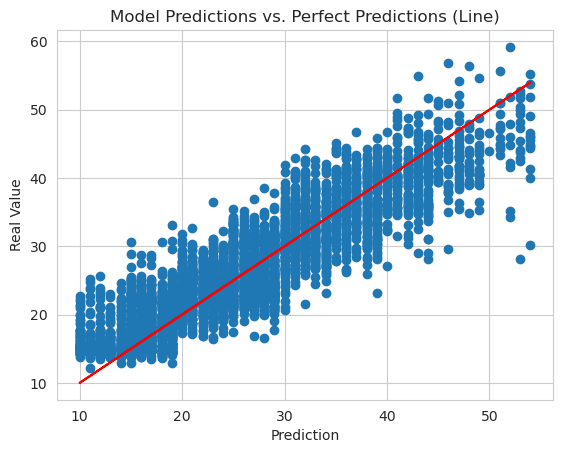
The final model was trained for a total of 25 epochs to prevent overfitting based on validation tests. During training, the model demonstrated its ability to explain up to 0.78% of the variance in the data, indicating a good fit to the underlying patterns and relationships.
The performance of the model was evaluated using several metrics. The Mean Absolute Error (MAE) was approximately 3.50, the Root Mean Squared Error (RMSE) was around 4.38, and the Mean Squared Error (MSE) was approximately 19.19. These metrics provide an indication of the average magnitude of the errors between the predicted delivery times and the actual delivery times.
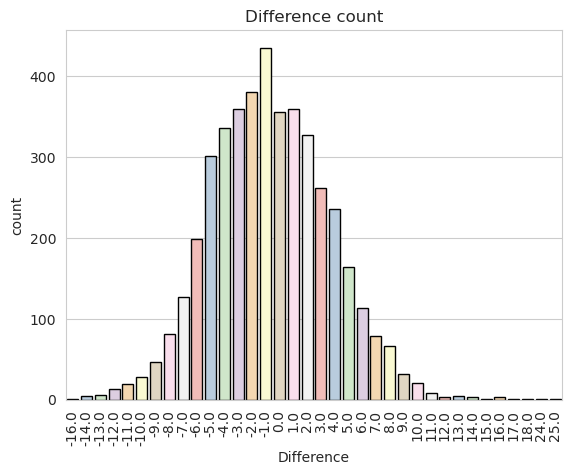
The model's performance in terms of the difference between predicted and actual delivery times was also assessed. The error difference mode, which represents the most frequently occurring difference between predicted and actual delivery times, was approximately 1 minute. Additionally, up to 75% of the observations had an error difference equal to or lower than 2 minutes, suggesting a relatively accurate prediction performance.
The worst prediction made by the model had a difference of 13 minutes compared to the actual delivery time. On the other hand, the best predictions were spot on, with a difference of 0 minutes, indicating instances where the model accurately predicted the exact delivery time.
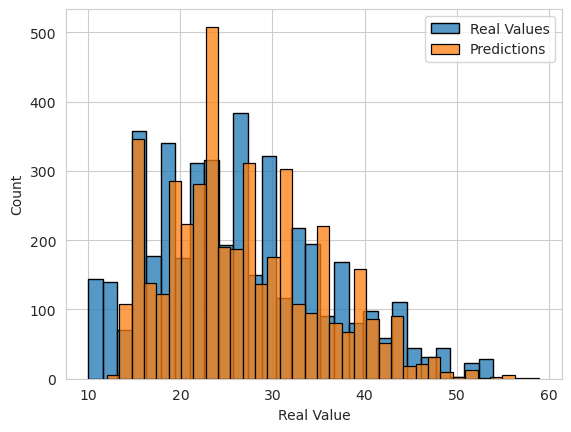
The distribution of predictions and actual values was found to be similar, suggesting that the model's predictions aligned well with the real data.
Overall, the model exhibited impressive performance, with an average error of only 1 minute. This indicates its ability to make accurate predictions of delivery times based on the provided features.
The model was prepared and packaged for deployment using a modular architecture from AWS. This architecture provides a framework that allows different development roles to work on their respective parts of the system while abstracting the complexity of integration, security, and environment configuration.

By adopting a modular approach, the deployment of the model becomes more scalable, flexible, and maintainable. Each component of the system can be developed and managed independently, enabling different teams to focus on their specific tasks without impacting the overall functionality of the system.
The modular architecture also facilitates the evolution of the ML workload over time. As new features or improvements are required, individual modules can be updated or replaced without disrupting the entire system. This allows for seamless integration of new technologies, algorithms, or data sources as the project progresses.
Furthermore, by leveraging AWS's modular architecture, the deployment of the model benefits from the platform's built-in security measures and environment configuration. This ensures that the system is protected against potential vulnerabilities and adheres to best practices for data privacy and compliance.
The blog post accompanying this deployment provides a detailed approach to building a modular ML workload. It outlines the steps involved in setting up the architecture, configuring the modules, and integrating the different components of the system. This approach aims to simplify the development and maintenance of the ML workload, promoting collaboration and efficiency across multiple teams.

Overall, the adoption of a modular architecture from AWS enables the deployment of the model in a scalable, flexible, and maintainable manner. It provides an effective framework for managing the complexities of integration, security, and environment configuration, while facilitating the evolution of the ML workload over time.
In conclusion, this project successfully leveraged various statistical and machine learning techniques to address a real-world problem in the context of Uber Technologies Inc. The objective was to develop an efficient prediction model for delivery time by uncovering hidden patterns and relationships within a large dataset.
The project followed a well-defined workflow, encompassing data collection, cleaning, and preprocessing, exploratory data analysis, model building, and evaluation. Each phase was approached systematically, utilizing tools such as Python, SQL, and visualization libraries to facilitate the analysis and modeling process.
One of the notable achievements of this project was the exploration of a modular architecture from AWS for deploying the developed model. This approach offered scalability, flexibility, and maintainability, allowing for seamless integration, enhanced security, and simplified configuration across multiple teams. The accompanying blog post provided a comprehensive guide, offering insights and best practices for building and deploying modular ML workloads using AWS.
As the project concludes, there are opportunities for further optimization and refinement. By incorporating additional data and exploring advanced techniques, the model's performance can be enhanced, leading to even more accurate predictions and actionable insights for Uber.
In summary, this project successfully addressed the delivery time prediction problem, highlighting the value of data science methodologies and showcasing the benefits of a modular architecture for deployment. The insights gained from this project can inform decision-making and contribute to the improvement of Uber's operations.