Tracing
ParSeq provides a couple of mechanisms for observing the execution of tasks. We have a mechanism for capturing traces, serializing as JSON data and rendering them. We also have logging facilities.
At any time (even mid-execution) it is possible to ask a Task for its trace information, using the following interaction:
final Task<String> task = ...;
engine.run(task);
final Trace trace = task.getTrace();
The Trace object includes information about the task such as its name, when it was started and completed, it may include its value (see setTraceValueSerializer() method) and references to tasks that are related to the task. See the Trace javadoc for details.
ParSeq can serialize a trace to JSON using the following code:
TraceUtil.getJsonTrace(task);This will produce an output that has the following basic structure:
{
  "traces": [
    {
      "id": 5,
      "name": "printResults",
      "resultType": "SUCCESS",
      "hidden": false,
      "systemHidden": false,
      "startNanos": 1.3486979401871e+18,
      "endNanos": 1.3486979401876e+18
    },
    {
      "id": 0,
      "name": "seq",
      "resultType": "SUCCESS",
      "hidden": false,
      "systemHidden": true,
      "startNanos": 1.3486979400423e+18,
      "endNanos": 1.3486979401876e+18
    },
    ...
  ],
  "relationships": [
    {
      "relationship": "PARENT_OF",
      "from": 0,
      "to": 5
    },
    ...
  ]
}
ParSeq has some tools for inspecting a trace.
To use the tools, navigate to subprojects/parseq-tracevis-server in the source tree and follow the instructions in the README.
Once you have the trace visualization server up, copy the JSON trace into the "Insert JSON trace here" box. If you just want to try out the viewer, you can copy JSON trace below (which is also used to generate the visualization examples further down in this document).
{"traces":[{"id":0,"name":"ClassifierPlan[viewerId=0]","resultType":"SUCCESS","hidden":false,"systemHidden":false,"startNanos":96818647436707,"pendingNanos":96818659312481,"endNanos":96818901514883},{"id":1000,"name":"getNetwork","resultType":"SUCCESS","hidden":false,"systemHidden":false,"startNanos":96818666141313,"pendingNanos":96818667003418,"endNanos":96818754825382},{"id":1001,"name":"SelfClassifier","resultType":"SUCCESS","hidden":false,"systemHidden":false,"startNanos":96818663148092,"pendingNanos":96818663262663,"endNanos":96818663296319},{"id":1002,"name":"ConnectedClassifier","resultType":"SUCCESS","hidden":false,"systemHidden":false,"startNanos":96818754948041,"pendingNanos":96818756094010,"endNanos":96818756102474},{"id":1003,"name":"getGroupInvited","resultType":"SUCCESS","hidden":false,"systemHidden":false,"startNanos":96818667061658,"pendingNanos":96818667082056,"endNanos":96818709247434},{"id":1004,"name":"GroupInvitedClassifier","resultType":"SUCCESS","hidden":false,"systemHidden":false,"startNanos":96818709364382,"pendingNanos":96818710233371,"endNanos":96818710240039},{"id":1005,"name":"seq","resultType":"SUCCESS","hidden":false,"systemHidden":true,"startNanos":96818665926022,"pendingNanos":96818665991211,"endNanos":96818710287659},{"id":1006,"name":"getMessaged","resultType":"SUCCESS","hidden":false,"systemHidden":false,"startNanos":96818667117430,"pendingNanos":96818667150564,"endNanos":96818754952976},{"id":1007,"name":"MessagedClassifier","resultType":"SUCCESS","hidden":false,"systemHidden":false,"startNanos":96818756253186,"pendingNanos":96818756305298,"endNanos":96818756309510},{"id":1008,"name":"seq","resultType":"SUCCESS","hidden":false,"systemHidden":true,"startNanos":96818666048607,"pendingNanos":96818666105018,"endNanos":96818756332448},{"id":1009,"name":"NetworkClassifier","resultType":"SUCCESS","hidden":false,"systemHidden":false,"startNanos":96818756688609,"pendingNanos":96818757321863,"endNanos":96818757328196},{"id":1010,"name":"getCommonGroups","resultType":"SUCCESS","hidden":false,"systemHidden":false,"startNanos":96818757477582,"pendingNanos":96818757502704,"endNanos":96818900789693},{"id":1011,"name":"CommonGroupsClassifier","resultType":"SUCCESS","hidden":false,"systemHidden":false,"startNanos":96818900992583,"pendingNanos":96818901091373,"endNanos":96818901110558},{"id":1012,"name":"seq","resultType":"SUCCESS","hidden":false,"systemHidden":true,"startNanos":96818757384628,"pendingNanos":96818757446857,"endNanos":96818901170222},{"id":1013,"name":"DefaultClassifier","resultType":"SUCCESS","hidden":false,"systemHidden":false,"startNanos":96818901416762,"pendingNanos":96818901929719,"endNanos":96818901936336},{"id":1014,"name":"seq","resultType":"SUCCESS","hidden":false,"systemHidden":true,"startNanos":96818665737410,"pendingNanos":96818665810359,"endNanos":96818756143034},{"id":1015,"name":"par","resultType":"SUCCESS","hidden":false,"systemHidden":true,"startNanos":96818664929345,"pendingNanos":96818665661715,"endNanos":96818756451199},{"id":1016,"name":"par","resultType":"SUCCESS","hidden":false,"systemHidden":true,"startNanos":96818756573836,"pendingNanos":96818756648512,"endNanos":96818901273032},{"id":1017,"name":"seq","resultType":"EARLY_FINISH","hidden":false,"systemHidden":true,"startNanos":96818660397841,"pendingNanos":96818663068670,"endNanos":96818901793426}],"relationships":[{"relationship":"PARENT_OF","from":0,"to":1017},{"relationship":"POTENTIAL_PARENT_OF","from":0,"to":1013},{"relationship":"PARENT_OF","from":1005,"to":1003},{"relationship":"PARENT_OF","from":1005,"to":1004},{"relationship":"PARENT_OF","from":1014,"to":1000},{"relationship":"PARENT_OF","from":1008,"to":1006},{"relationship":"SUCCESSOR_OF","from":1002,"to":1000},{"relationship":"PARENT_OF","from":1008,"to":1007},{"relationship":"PARENT_OF","from":1014,"to":1002},{"relationship":"PARENT_OF","from":1017,"to":1001},{"relationship":"PARENT_OF","from":1015,"to":1005},{"relationship":"SUCCESSOR_OF","from":1004,"to":1003},{"relationship":"PARENT_OF","from":1012,"to":1010},{"relationship":"PARENT_OF","from":1015,"to":1008},{"relationship":"PARENT_OF","from":1012,"to":1011},{"relationship":"PARENT_OF","from":1016,"to":1009},{"relationship":"SUCCESSOR_OF","from":1007,"to":1006},{"relationship":"PARENT_OF","from":1016,"to":1012},{"relationship":"SUCCESSOR_OF","from":1015,"to":1001},{"relationship":"PARENT_OF","from":1015,"to":1014},{"relationship":"PARENT_OF","from":1017,"to":1013},{"relationship":"PARENT_OF","from":1017,"to":1015},{"relationship":"PARENT_OF","from":1017,"to":1016},{"relationship":"SUCCESSOR_OF","from":1011,"to":1010},{"relationship":"SUCCESSOR_OF","from":1013,"to":1016},{"relationship":"SUCCESSOR_OF","from":1016,"to":1015}]}The trace tool allows some basic filtering:
-
User hidden tasks when checked - shows tasks that user code indicated should not be displayed. This is unchecked by default, but can be checked to get a complete view of an execution.
-
System hidden tasks when checked - shows tasks that the ParSeq system indicated should not be displayed. This is unchecked by default to make it easier to see user tasks without the clutter of system tasks.
-
Parent tasks when checked - shows tasks that contains other tasks. In other words, with this option unchecked you will only see leaf tasks (tasks with no children). This option is checked by default.
Each of the views uses a color scheme to indicate the status of a task.
- Green indicates success
- Red indicates an error
-
Yellow indicates that a task was cancelled with
EarlyFinishExceptionbecause its parent finished before the task itself finished - Gray indicates a task that was not finished (either successfully or with an error) at the time the trace was taken
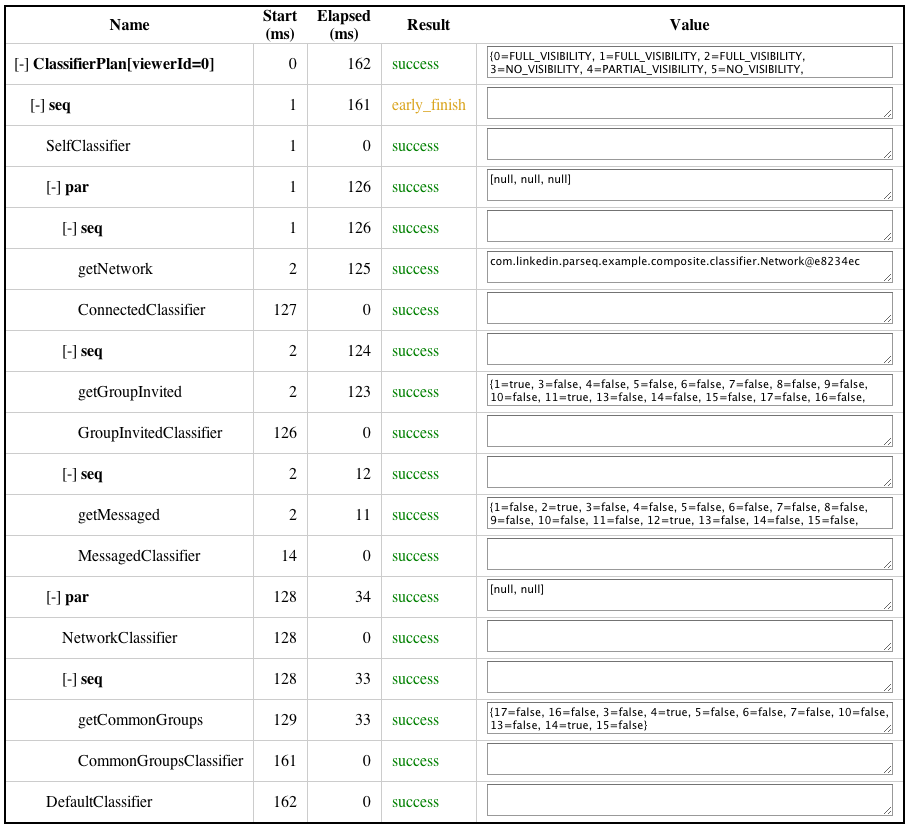
The waterfall view shows how long each task took to complete. Parent tasks, marked with little black triangles, are collapsable/expandable.Hovering over parent task greys out all tasks that are not one of its descendants. This view can give you a sense for which tasks in the graph took the most time to execute.

The graphviz view shows detailed information about relationship between tasks.
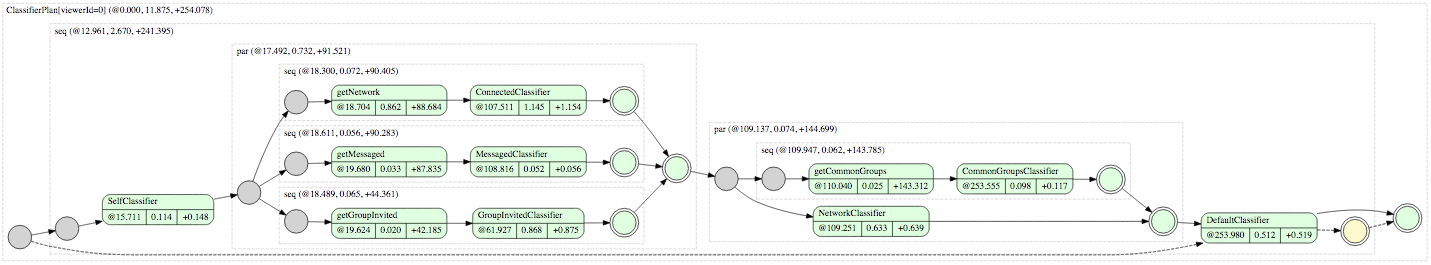
The output (including System hidden tasks) looks like the following:
You can interactively zoom in/out as well as pan the view to see in details particular part of the diagram. Use mouse, mousewheel, touchpad or zoom/pan control.
Additionally time slider control helps you undesrtand how the plan progressed through time. We accurately measure when task was started and when it was finished but we dont measure it progress during the execution. This visualization interpolates completeness of each task based on its start and stop time e.g. if task started at 3ms and finished at 7ms it will show that task was 75% complete when slider is at 6ms.

Below is detailed description of elements of the diagrams generated in Graphviz View.
Tasks are represented as nodes in the graph.
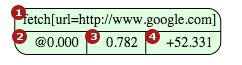
They have a (1) name, a box with (2) @start-time, (3) self-time and (4) +elapsed-time. The start-time indicates when the task started in milliseconds relative to the start of the root task. The self-time indicates amount of time spent in ParSeq thread. The elapsed-timestamp indicates the time elapsed from the start of the task to the time it completed.
Edges between tasks indicate ordering.

For example, in the graph above fetch task was run after id task.
In some cases you may see a dashed line between tasks. This indicates that one task was declared to run after the other, but when the plan was executed the successor task was executed due to some other reason (like the completion of another task).
Parent tasks are tasks that trigger the execution of one or more child tasks. They are represented in the graph as a box with a dashed edge.

Like normal tasks, they have a (1) name, (2) @start-time, (3) self-time and (4) +elapsed-time. They also contain all of their child tasks - HEAD http://www.google.com in example above.
Parent tasks have a grey circle that represents where a parent task was started. They have a double circle to indicate where they finished. Color of double circle indicates the result type of the parent task.
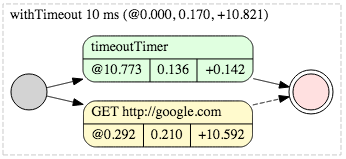
An edge from a grey circle - known as a source - to a task indicates that the task was kicked off as a direct result of executing the parent task. In example above withTimeout 10 ms task directly caused execution of timeoutTimer task and GET http://google.com task.
An edge from a task to a double circle - known as a sink - indicates that the task was one of the final tasks run before finishing the parent task. In example above timeoutTask was final task run before finishing teh parent task.
In some cases an edge between a task and a sink will be dashed. This indicates that parent task did not wait for completion of that task. In example above timeoutTimer task failed the parent task with TimeoutException (notice red color of double circle) before GET http://google.com finished (dashed line between the child task and double circle means that parent finished before the child, moreover: yellow color means that GET http://google.com task was cancelled with EarlyFinishException).
You may sometimes see dashed edge between source and a task that is located outside th eparent task.
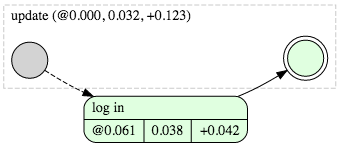
This indicates that the task could have been run by the parent task but was actually run in some other way - by different parent task or even in the context of different plan. In example above update task would have run log in task but it already has run in the context of a different plan.
The table view is a text representation of the JSON trace. This is the only view that shows a text representation of the result of a task (as serialized by setTraceValueSerializer() method).
We have 3 types of loggers that log basic events as they occur:
- Log events for root tasks
- Set logger "com.linkedin.parseq.Engine:root" to DEBUG or TRACE.
- A root task is a task that is given to an Engine with
engine.run(task). - This loggers helps to get a sense for how long plans take to run without generating large volumes of logs.
- Log events for plan tasks
- Set logger "com.linkedin.parseq.Engine:planClass=XTask" to DEBUG or TRACE.
- When executed by
engine.run(task)theplanClassis simply a class name of the task being executed. This is particularly usefule with ParSeq v1.x where new tasks were created mostly through class inheritance. In ParSeq 2.x it is possible to specifyplanClasswhen passing task to engineengine.run(task, planClass)where planClass is an arbitraryStringthat will be mapped to a logger. - When the root task is of type XTask this logger will log events for XTask and any tasks that are transitively executed (i.e. its child tasks, their child tasks, etc.).
- This logger helps to get a deeper understanding of each step taking during the execution of a particular plan.
- Log events for all tasks
- Set logger "com.linkedin.parseq.Engine:all" to DEBUG or TRACE
- This logs events for every tasks that is executed.
- This logger can be quite verbose, so logger #1 and #2 above should be preferred where appropriate.
At the DEBUG level, loggers will log the following events:
2012-09-26 15:18:16,910 [plan=0]: Starting task 'fetch[url=http://www.yahoo.com]'
2012-09-26 15:18:16,994 [plan=0]: Ending task 'fetch[url=http://www.yahoo.com]'. Elapsed: 81ms, Result type: SUCCESS.
At the TRACE level, loggers will log the following events:
2012-09-26 15:19:00,055 [plan=0]: Starting task 'fetch[url=http://www.bing.com]'
2012-09-26 15:19:00,101 [plan=0]: Ending task 'fetch[url=http://www.bing.com]'. Elapsed: 42ms, Result type: SUCCESS. Value: <!doctype html><html>...