-
Notifications
You must be signed in to change notification settings - Fork 40
Debugging Selenium tests with Steward
Debugging of you tests is both easy and useful - it allows you to step your test line-by-line and watch behavior of the browser, add breakpoints to pause test execution on given line or use watches to inspect current values of variables.
To make this possible, you only need:
- PHP with Xdebug extension, set up for remote debugging
- IDE with debugging support (PHPStorm, NetBeans etc.)
- Start Steward with
--xdebugparameter
First install Xdebug extension into the PHP environment (where you will run tests using Steward). Consult Xdebug docs for detailed information how to install Xdebug on your operating system.
Then make sure the extension is enabled for PHP in the CLI mode:
$ php -m # this will show all enabled PHP modules and extensions
...
xdebug
If you don't see xdebug there, make sure the extension is enabled in your php.ini (or xdebug.ini) - run php --ini to see where are these configuration files located.
Next step is to set following configuration options in the php.ini file - add or uncomment (by removing leading semicolon) following values in [xdebug] section:
For Xdebug 3:
[xdebug]
zend_extension=/path/to/xdebug.so # this may already be present in the config file, you may just need to uncomment this line
xdebug.mode=debug
xdebug.client_host=127.0.0.1
xdebug.client_port=9003
For Xdebug 2:
[xdebug]
zend_extension=/path/to/xdebug.so # this may already be present in the config file, you may just need to uncomment this line
xdebug.remote_enable=1
xdebug.remote_handler=dbgp
xdebug.remote_mode=req
xdebug.remote_host=127.0.0.1
xdebug.remote_port=9000
See Xdebug documentation for more information about remote debugging.
Now your PHP environment should be ready to go.
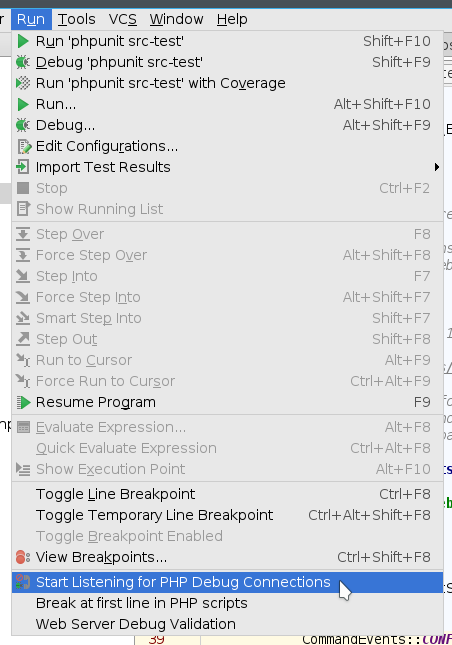
You can do it either by the button in the "Run Configurations" panel or using the Run menu:
 |
 |
|---|
By default IDEA / PHPStorm listens on port 9000 and 9003, so that is works with default settings of both Xdebug version 2 and 3. You can check or change the port in IDEA / PHPStorm Settings > Languages & Frameworks > PHP > Debug > Debug port.
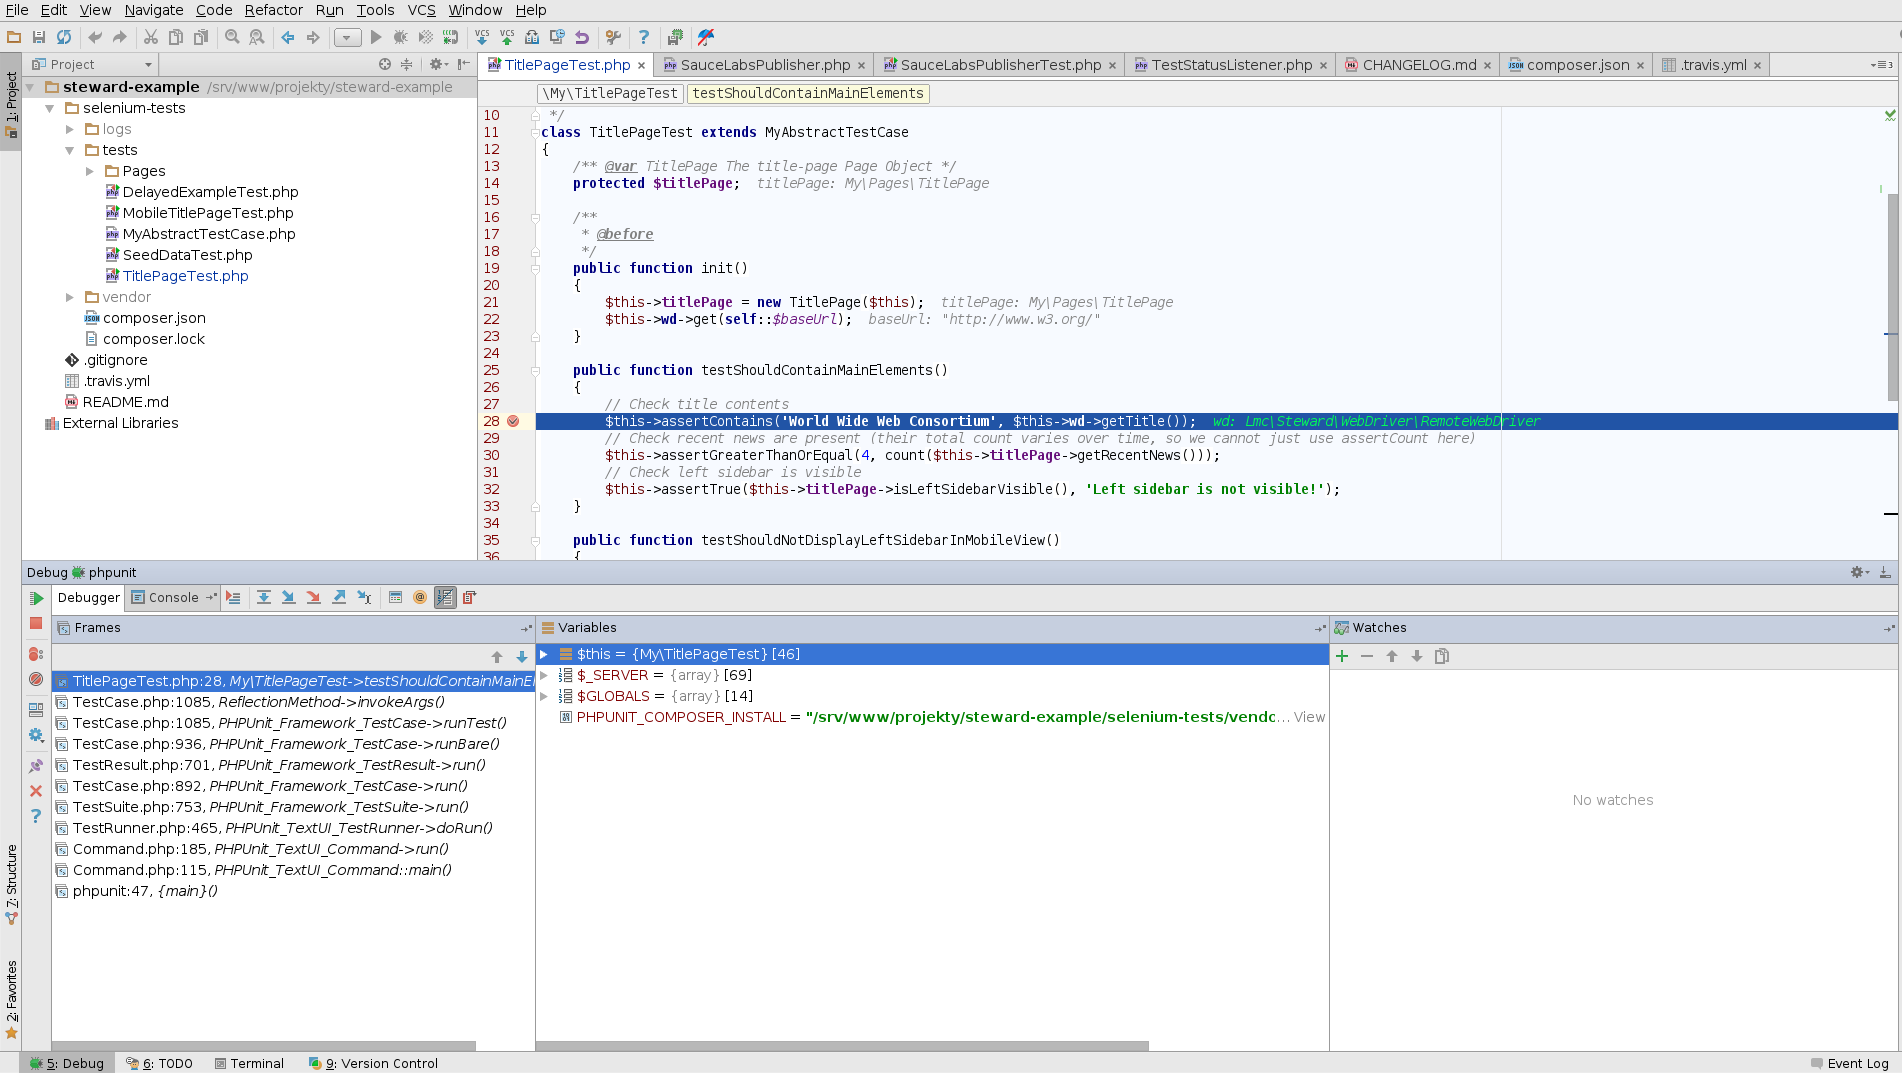
This is where the test execution will be paused.
 |
|---|
You just need to add the --xdebug option to the run command of Steward:
$ vendor/bin/steward run staging firefox --xdebugYou may want to run only one test (the one you want to debug). Then you can take advantage of the --pattern option:
$ vendor/bin/steward run staging firefox --xdebug --pattern TitlePageTest.phpOnce the test execution reaches your defined breakpoints, it will we paused and you can debug it - see content of the variables, step it line by line and so on.
 |
|---|
The --xdebug option will work by default with PHPStorm, but if you use different IDE (like NetBeans), you will need to specify custom Xdebug identifier (so called "IDE key") as a value of the --xdebug option, so that Xdebug connects to your IDE. Eg. for NetBeans the run command will looke like this:
$ vendor/bin/steward run staging firefox --xdebug=netbeans-xdebugAnd that's it! 🎉 Now you can fully enjoy new level of tests debugging: no more crazy var_dumping or echoing variables directly to the output, adding sleep() to see what the browser just did etc.