
You can get genome_coverage_plotter by pulling it from git:
git clone https://github.com/matted/genome_coverage_plotter.git
To run genome_coverage_plotter, several Python packages are required. On a Ubuntu-like system, these commands will get the appropriate dependencies:
sudo apt-get install python python-dev build-essential python-setuptools python-numpy python-scipy python-pylab python-pandas
sudo easy_install pysam seaborn
If you want the genome_coverage_plotter tools on your system path (and want to get the dependencies automatically), install it with:
sudo python setup.py install
There is also a Docker image that has genome_coverage_plotter and its dependencies preinstalled here.
Run the script on a sorted, indexed bam file:
python plot_coverage.py yeast_test_small.bam
The output is:
chromosome normalized_coverage
chr10	   1.0000
chr11	   1.0264
chr12	   1.0556
chr13	   1.0000
chr14	   1.0000
chr15	   0.9444
chr16	   1.0000
chr1	   0.8889
chr2	   1.0000
chr3	   1.0556
chr4	   1.0083
chr5	   1.0000
chr6	   1.0472
chr7	   1.0000
chr8	   1.0889
chr9	   0.8889
And it creates an output plot image based on the input filename, like:
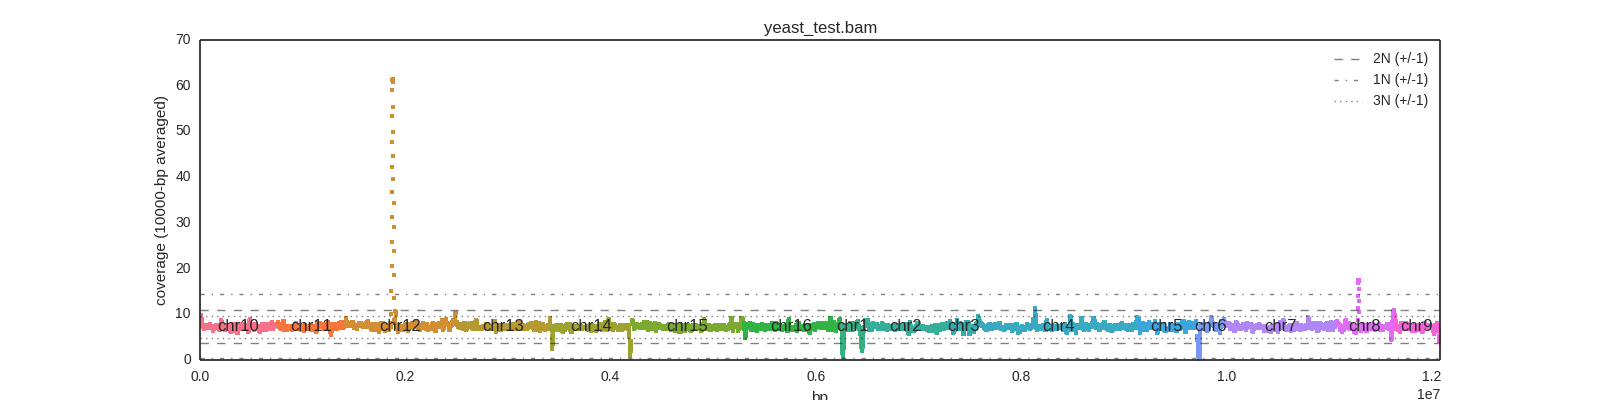
The chromosomes are ordered based on their order in the input file.
All the parameters and plot options are currently hardcoded.