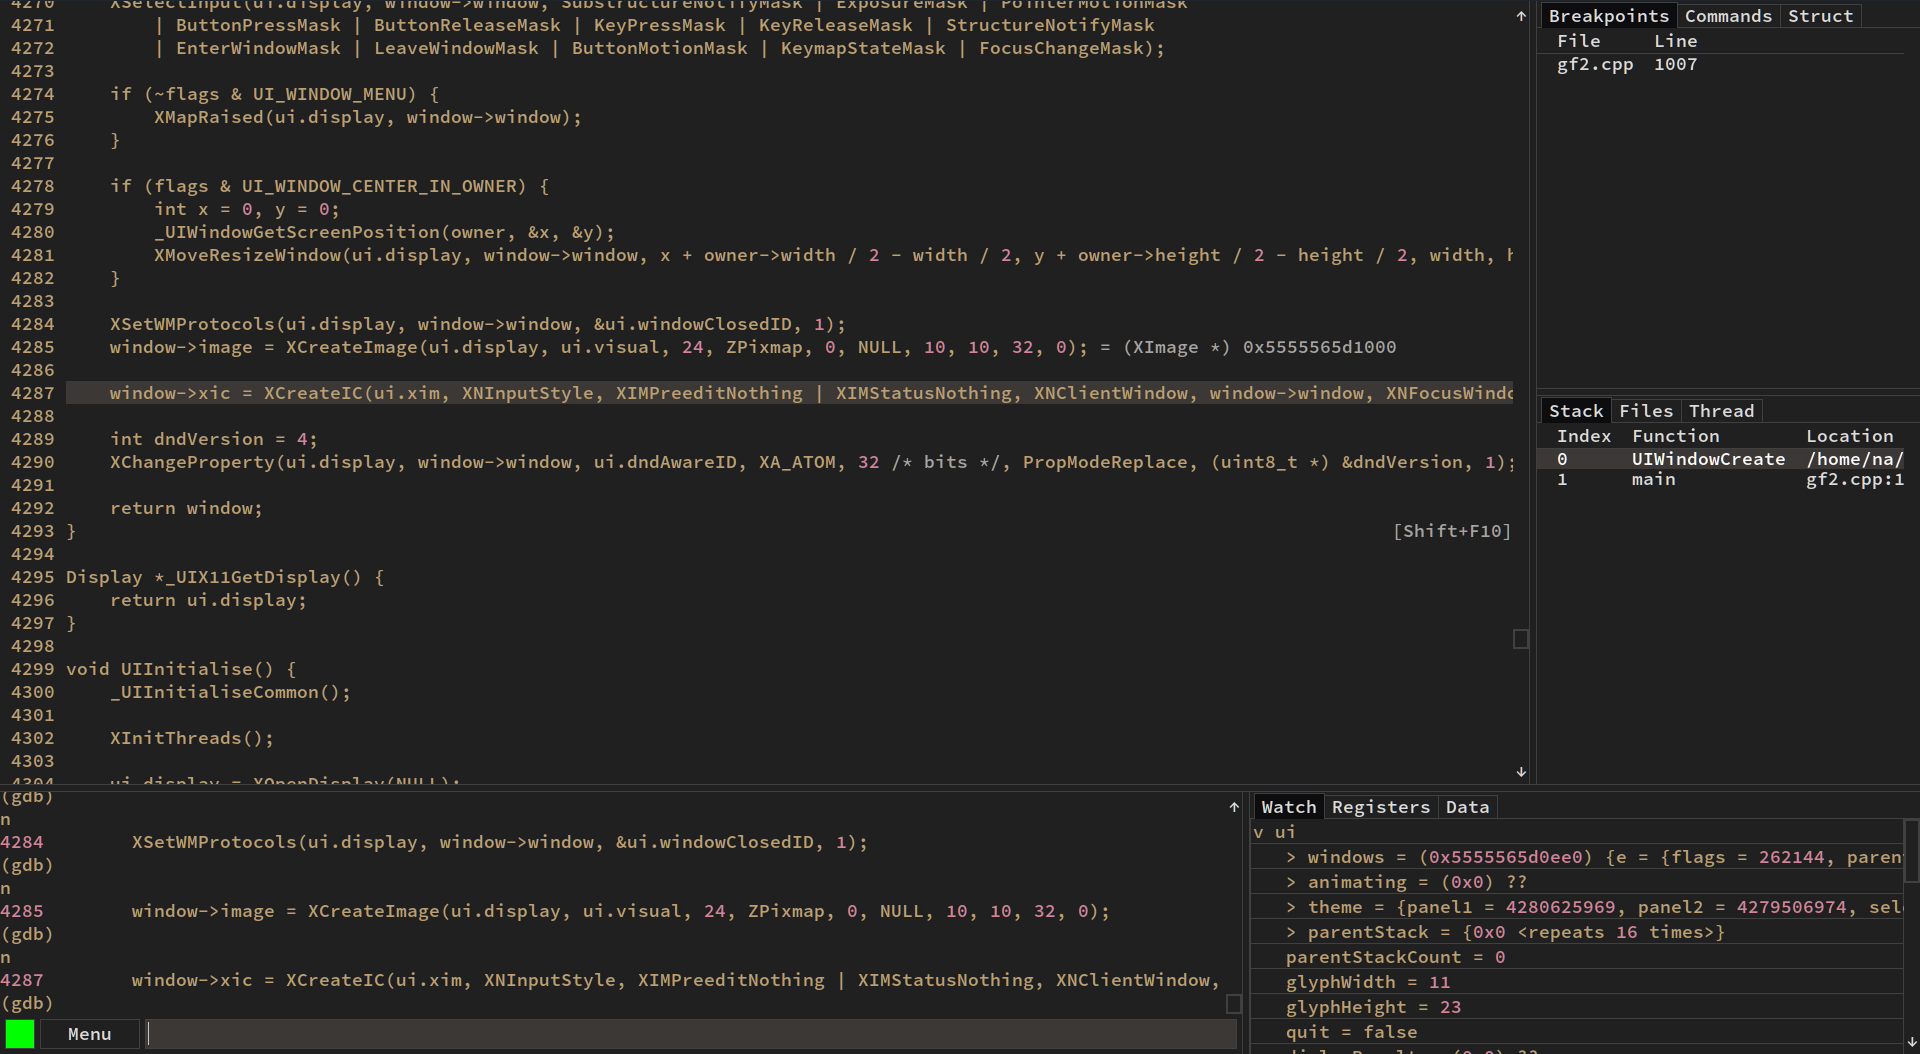
Download this project's source.
git clone https://github.com/nakst/gf.gitAnd compile the application.
# linux
./build.sh

# freebsd
./build_freebsd.sh

# netbsd
./build_netbsd.sh

# openbsd
./build_openbsd.sh
Please read the rest of this file to learn about using and configuring gf. If you're new to GDB, see this article.
If you want to make a debug build of gf, use a command like g++ gf2.cpp -g -lX11 -pthread.
- You can run the application with
./gf2. Any additional command line arguments passed togfwill be forwarded to GDB. - Press Ctrl+Shift+P to synchronize your working directory with GDB after you start your target executable. This is necessary if you open
gfin a different directory to the one you compile in. - To view RGBA bitmaps, select the
Datatab and then selectAdd bitmap.... - Ctrl+Click a line in the source view to run "until" that line. Shift+Click a line in the source view to skip to it without executing the code in between.
- Press Shift+F10 to step out of a block, and press Shift+F11 to step out a function.
- Press Tab while entering a watch expression to auto-complete it.
- Press
/with a watch expression highlighted to change the format specifier. For example,/xswitches to hexadecimal view. - Press backtick to enter line inspect mode. This mode evaluates all expressions on the current line.
- Use
gf2 --rr-replayfor replaying a trace recorded by rr. Use Ctrl+Shift+(F5/F10/F11) for reverse continue and step.
You may want to add the following commands to your ~/.gdbinit file:
set breakpoint pending on
set disassembly-flavor intel
On startup, settings are loaded from ~/.config/gf2_config.ini, followed by .project.gf. This is an INI-style file.
You can pass additional arguments to GDB in the [gdb] section. For example,
[gdb]
arguments=-nx -ex record
You can also change the location of the GDB executable. For example,
[gdb]
path=/home/a/opt/gdb
You can direct all output from GDB to be sent to the "Log" window, if you have one in your layout string. This will work even if you haven't setup a log pipe. This can be used to view the stderr output from your target dynamically as it is running.
[gdb]
log_all_output=1
You can disable the confirmation dialogs for the kill (F3) and connect (F4) commands.
[gdb]
confirm_command_kill=0
confirm_command_connect=0
You can limit the number of stack frames in the stack window (the default is 50).
[gdb]
backtrace_count_limit=50Keyboard shortcuts are placed in the [shortcuts] section. For example,
[shortcuts]
Ctrl+I=print i
Ctrl+Shift+F10=reverse-next
Ctrl+Shift+F11=reverse-step
You can use any standard GDB command, or any of the commands listed in "Special commands" below.
You can change the font and user interface scaling in the [ui] section. For example,
[ui]
scale=1.5
font_path=/usr/share/fonts/TTF/DejaVuSansMono.ttf
font_size_interface=17
font_size_code=20
To change the font, FreeType must have been available when you compiled gf. You can enable subpixel font rendering by recompiling with extra_flags=-DUI_FREETYPE_SUBPIXEL ./build.sh.
You can also configure the interface layout, with the layout parameter. Use h(position,left,right) to create a horizontal split, v(position,left,right) to create a vertical split, and t(...) to create a tab pane. This value should not contain any whitespace. Please note this value is not validated, so make sure it is formatted correctly!
layout=h(75,v(75,Source,Console),v(50,t(Watch,Breakpoints,Commands,Struct,Exe),t(Stack,Files,Registers,Data,Thread))))NB: Horizontal and vertical splits must have exactly two children. Instead, you can nest them to create more complex layouts.
You can maximize the window at startup with maximize=1.
You can request for the expressions in the watch window to be saved and restored by setting restore_watch_window=1.
You can allow selecting text in the source window by setting selectable_source=1.
You can change the theme in the theme section. See https://github.com/nakst/gf/wiki/Themes for a list of examples.
You can create a list of quickly accessible commands, available in the "Commands" tab in the UI. Separate individual commands using a semicolon. Each command in the list is run one after another; to run the final command asynchronously, put a & at the end. For example,
[commands]
Compile=shell gcc -o bin/app src/main.c
Run normal=file bin/app;run&
Run tests=file bin/app;run test_cases.txt&
Set breakpoints=b main;b LoadFile;b AssertionFailure
You can use any standard GDB command, or any of the commands listed in "Special commands" below.
You can change the server name with the server_name key in the vim section. For example,
[vim]
server_name=MyVimServerYou can change the loaded file and line by sending commands to the control pipe.
First, you must set the location of the control pipe. In the [pipe] section of the configuration file, set the control key to the absolute path where you want the control pipe to be.
Then, you can send commands to the pipe. For example,
# Load the specified file (must be a full path).
echo f /home/a/test.c > /home/a/control_pipe.dat

# Go to line 123.
echo l 123 > /home/a/control_pipe.dat

# Send a GDB command.
echo c file myapp > /home/a/control_pipe.dat
This can be used for text editor integration.
You can show messages send to a pipe using the log window.
First, you must set the location of the log pipe. In the [pipe] section of the configuration file, set the log key to the absolute path where you want the log pipe to be. Next, you must add the "Log" window somewhere in your layout string (see the "User interface" section above). Once configured, you can then send messages to the pipe and they will appear in the log window.
Here is an example of how to send messages to the pipe:
#define LOG(...) do { fprintf(logFile, __VA_ARGS__); fflush(logFile); } while (0)
#define LOG_OPEN(path) logFile = fopen(path, "w")
FILE *logFile;

...

LOG_OPEN("...");
LOG("Hello, world!\n");gf-step either steps a single line (step) or single instruction (stepi), depending whether disassembly view is active.
gf-next either steps over a single line (next) or single instruction (nexti), depending whether disassembly view is active.
gf-step-out-of-block steps out of the current block. That is, it steps to the next line after the first unmatched }, starting from the current line.
gf-restart-gdb restarts the GDB process immediately. Any state such as loaded symbol files or breakpoints will be lost.
gf-get-pwd asks GDB for the working directory in which the current executable file was compiled. This ensures the source view tries to load files from the correct directory.
gf-switch-to <window-name> switches to a specific window. The window names are the same as given in the layout string, as seen in the "User interface" section.
gf-command <name> runs the command(s) corresponding to <name> in the [commands] section of your configuration file.
gf-inspect-line toggles inspect line mode. By default, this is bound to the backtick key.
You can customize the behaviour of the watch window when displaying specific types using Python. When the watch window wants to display the fields of a value, it will look a hook function at gf_hooks[type_of_value]. The hook function should take two arguments, item and field. If the hook function exists, it will be called in one of two ways:
- When the watch window needs a list of the fields in the value, it calls the hook with
itemset to an opaque handle andfieldset toNone. You should print out a list of all the names of the fields in the value, one on each line. You can print out all the standard fields by calling_gf_fields_recurse(item). When adding custom fields, their names must be enclosed by[]. - When the watch window needs to get the value of a specific custom field in the value, it calls the hook with
itemset to agdb.Valuefor the value, andfieldto the name of the custom field that was added. The hook is not called for standard fields. You should return agdb.Valuethat gives the value of the field.
For example, the following hook add a width and height custom field for a rectangle type.
def RectangleHook(item, field):
    if field:
        if field == '[width]':
            # item['...'] looks up a field in the struct, returned as a gdb.Value
            # int(...) converts the gdb.Value to an int so we can do arithmetic on it
            # gdb.Value(...) converts the result back to a gdb.Value
            return gdb.Value(int(item['right']) - item['left'])
        if field == '[height]':
            # do something similar for the height
            return gdb.Value(int(item['bottom']) - item['top'])
    else:
        print('[width]')         # add the width custom field
        print('[height]')        # add the height custom field
        _gf_fields_recurse(item) # add the fields actually in the struct

gf_hooks = { 'Rectangle': RectangleHook } # create the hook dictionary
If you want to create a custom dynamic array type, instead of printing field names, print (d_arr) followed by the number of array items. The fields will then be automatically populated in the form of [%d], where %d is the index. For example, given the following structure:
struct MyArray {
	int length;
	float *items;
};
This is the hook definition:
def MyArrayHook(item, field):
	if field: return item['items'][int(field[1:-1])]
	else: print('(d_arr)', int(item['length']))
Templates are removed from the name of the type. For example, Array<int>, Array<char *> and Array<float> would all use the Array hook.
There is a simple plugin system. Make a file called plugins.cpp in the source code folder. It will be found automatically, and #included in the compilation of the main translation unit.
gf uses the Luigi UI library. It is documented here: https://github.com/nakst/luigi/blob/main/README.md.
You can register new windows, command and data viewers in a constructor function. For example,
__attribute__((constructor))
void MyPluginRegister() {
	interfaceWindows.Add({
		"Hello", // The window's name. Used to match it against the UI layout string.
		MyPluginHelloWindowCreate, // The callback to create an instance of the window.
		MyPluginHelloWindowUpdate // The callback to update an instance of the window (called every time the target pauses/steps).
	});

	interfaceDataViewers.Add({
		"Add test...", // The label of the button to show in the Data tab.
		MyPluginTestViewerCreate // The callback to create the data viewer.
	});

	interfaceCommands.Add({
		"My command", // The label to show in the application menu.
		{ /* UIShortcut */ }
	});
}
The interface window creation callback is passed the parent UIElement and should return the UIElement it creates.
UIElement *MyPluginHelloWindowCreate(UIElement *parent) {
	UIPanel *panel = UIPanelCreate(parent, UI_PANEL_GRAY | UI_PANEL_EXPAND);
	UILabelCreate(&panel->e, 0, "Hello, world!", -1);
	return &panel->e;
}
The interface window update callback is passed the output of GDB from the most recent step, and the UIElement returned by the creation callback.
void MyPluginHelloWindowUpdate(const char *gdbOutput, UIElement *element) {
	// TODO Update the window.
}
The interface data viewer creation callback should create a MDI child of the data tab as follows:
void MyPluginTestViewerCreate(void *unused) {
	UIMDIChild *window = UIMDIChildCreate(&dataWindow->e, UI_MDI_CHILD_CLOSE_BUTTON, UI_RECT_1(0), "Title", -1);
	// TODO Configure the viewer.
	UIElementRefresh(&dataWindow->e);
}
For communicating with GDB, there are the following functions.
// Evaluate an expression. The result is overwritten between calls!
const char *EvaluateExpression(const char *expression, const char *format = nullptr);

// Send and run a command in GDB. Set `echo` to log the command in the console window.
// If `synchronous` is set the function will wait for the command to complete before it returns.
void DebuggerSend(const char *string, bool echo, bool synchronous);
There are many examples of how to do these things in windows.cpp.
nakst
Philippe Mongeau phmongeau
Jimmy "Keeba" Lefevre JimmyLefevre
John Blat johnblat64
IWouldRatherUsePasteBin
Gavin Beatty gavinbeatty
Michael Stopa StomyPX
Anders Kaare sqaxomonophonen
Arseniy Khvorov khvorov45
~~All tiers on my Patreon, https://www.patreon.com/nakst, get access to the extension pack. ~~
This is now available to all; see the folder extensions_v5.
This currently includes:
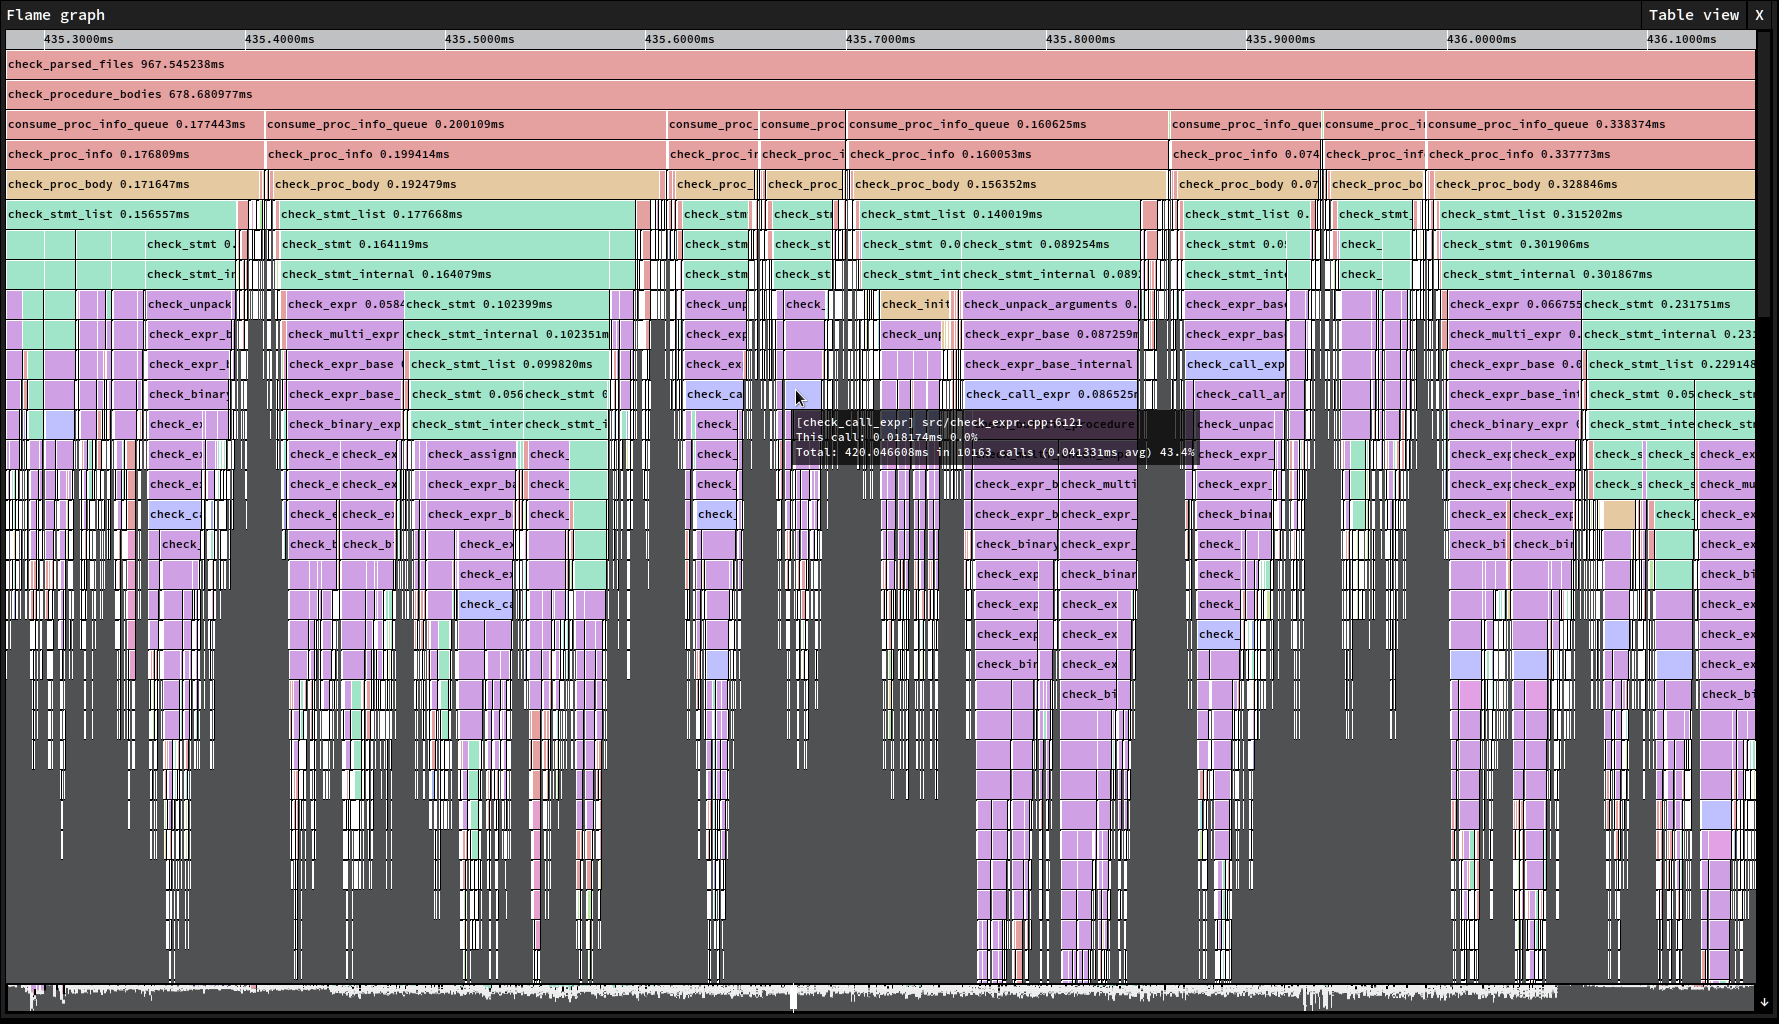
- Embedded tracing profiler
- Memory window
- Extended watch expression view (for strings, matrices and base conversion)
- Waveform viewer
- Full source code for the pack
Make sure you use the latest version of the extension pack with the latest commit of gf, otherwise you'll likely run into compile or runtime errors!


