-
Notifications
You must be signed in to change notification settings - Fork 39
Using OceanWATERS
If you have not already done so, you will need to set up your development environment, download OceanWATERS, and build it. To do this, see the Getting Started section in our main code repository.
To run OceanWATERS, execute the following commands (this example uses the Atacama simulator world):
cd oceanwaters_ws
source devel/setup.bash
roslaunch ow atacama_y1a.launch
(Subsequent launches in the same console will only require the last line.)
This will result in the production of a fair amount of console output as well as
display of rqt, rviz, and Gazebo windows that are useful for debugging
and system understanding. rqt provides a customizable GUI for inspecting
inter-process messaging and viewing simulated camera images. rviz
provides interactive 3D visualization showing planned lander arm trajectories
and executed arm trajectories, and the Gazebo GUI provides interactive 3D
visualization of the lander operating within the planetary surface environment.
The sheer amount of console output can be unsettling to new ROS users, but it is to be expected. You may also see some error messages that can be safely ignored. Unfortunately, ROS typically launches all its nodes simultaneously. This can cause them to emit warnings and errors before nodes are all properly communicating with one another. A list of errors, warnings, and other messages you may see are listed in the Caveats section of this user guide.
Please see our Tutorials page for some practical examples of running OceanWATERS and an introduction to the simulator's capabilities.
When launching OceanWATERS in its default configuration, some windows will
appear on your screen. Among these are gzclient (Gazebo's user interface),
rviz, and rqt. These are the most feature-rich tools for introspection,
debugging, and human interaction in a ROS/Gazebo simulation, and they should be
your first stop for understanding what is happening in OceanWATERS.
ROS inter-process communication is in the form of messages published and
subscribed to on named channels, or topics, in ROS terminology. In
addition to topics, ROS implements concepts of services and actions.
A processes communicating via ROS topics, services, or actions is referred to as
a node.
ROS provides a number of tools for monitoring message traffic as well as understanding system configuration and node connectivity. The following command:
rosnode list
will list all running nodes. To learn a particular node's details, such as information about its subscriptions and services, use:
rosnode info <node name>
The rostopic command-line tool provides a means of interacting with the ROS topics of a running network of ROS nodes. For example:
rostopic list
will list the current active topics, and:
rostopic echo /topic_name
will display messages published to the /topic_name topic. The rostopic tool
also provides the capability to manually publish a message on a topic.
Similar to rostopic, the rosservice command line tool provides information on active services. For example:
rosservice list
will list current active services.
The rqt tool can display a graph of ROS
nodes with topics, this facility is also available in the standalone rqt_graph
tool.
Event logging in OceanWATERS utilizes ROS's existing logging capabilities.
During runtime the ROS topic rosout_agg provides an aggregated feed of all
events logged by OceanWATERS nodes, and this feed can provide moment-to-moment
updates on events as they occur in the simulation.
The GUI rqt_console can be used during runtime to view logged events as they
are published, and events can be filtered by verbosity level.
Each simulation run will generate a rosout.log that contains, in text format,
the aggregated feed in its entirety. The rosout.log for the most recently ran
simulation can be found inside the ~/.ros/log/latest directory, or if you've
set the ROS_HOME environment variable it can be found in $ROS_HOME/log/latest.
Recording of any other type of ROS message (images, joint angles, ect.) can be accomplished in OceanWATERS with the bag recorder node. In ROS, messages of any type published by a topic can be recorded to a bag file, which can then be played back in sequence using either rosbag play from the command line or with the rqt_bag GUI. The data contained in the bag file can also be analyzed or even modified using the rosbag C++ and Python APIs.
To record a bag file in OceanWATERS the configuration files located in
ow_simulator/ow_bag_recorder/config should be set to the desired recording
settings. The bag recorder node will save messages published by any topic listed
in topics.yaml. The other configuration file, options.yaml, contains options to
customize the operation of the bag recorder node. A complete description of
these options can be found in the ow_simulator/ow_bag_recorder/README.md
file.
Once configuration files are set, launch the simulation using the method
described in 2.3 only set the record_bag flag to true.
roslaunch ow europa_terminator_workspace.launch record_bag:=true
A file with the extension ".bag.active" should now appear in your ~/.ros
directory, or $ROS_HOME. When the simulation ends, this file's extension will
be changed to .bag and can now be analyzed or played back using the ROS
utilities described above.
Note that setting the options record_all and node to a value that's not their
default will override the topic list in topics.yaml.
The "speed" at which the simulator runs relative to real time is known as its real-time factor. A real-time factor of 1 means real time in the world. A real-time factor greater than 1 is faster than real time.
The current real-time factor is shown in the bottom left corner of the Gazebo viewer:

At present the OceanWATERS simulator can be safely set to run at a maximum real-time factor of 3. Faster speeds can be specified, but the physics model currently used by Gazebo (ODE) will fail. In particular, terrain deformation will not work correctly.
The real-time factor is a product of the real-time update rate and the maximum timestep (also called maximum step size), both adjustable parameters in Gazebo. The default values for these are generally 400 and 0.0025, respectively, which yields a real-time factor of 1.
The best way to speed up the simulation is to increase the real-time update rate. Use a setting of 1200 for 3x real time, 800 for 2x real time, etc. Adjustments to the maximum timestep are possible, but can introduce physics issues.
There are 4 ways to set these parameters. The following examples use real-time update rate; there is a corresponding method for maximum timestep.
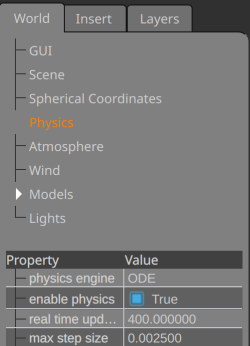
- Gazebo interface. Expand the Physics section of the World tab, and enter desired values for "real time update rate" and "max step size". You must hit Enter for the change to take effect.

- Command-line:
gz physics --update-rate=1200
gz physics --step-size=0.0025
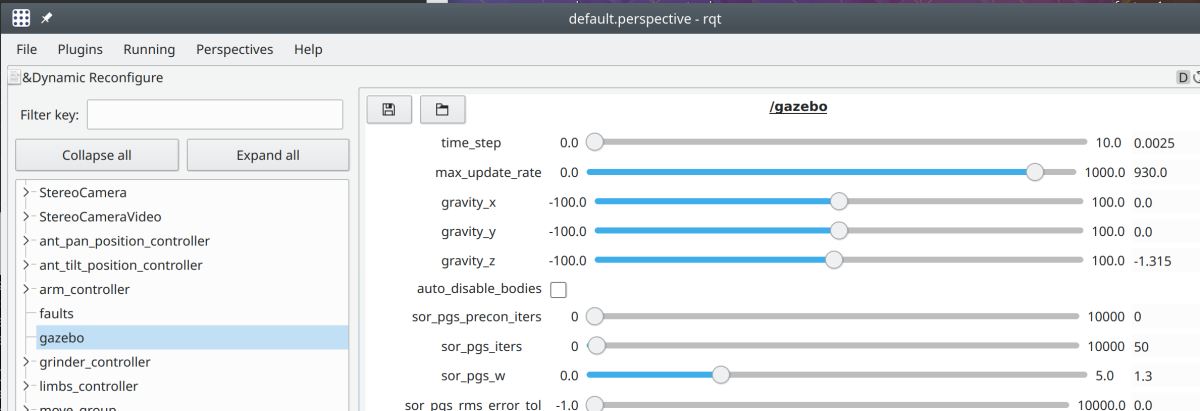
- rqt. In the Dynamic Reconfigure tab, select
gazeboand find slider bars fortime_stepandmax_update_rate. Note that the ranges are limited.

- World-specific. World files (e.g.
ow_europa/worlds/terminator_workspace.world) have aphysicselement where these settings are made, e.g.
<max_step_size>0.0025</max_step_size>
<real_time_update_rate>1200</real_time_update_rate>
The world file settings are the initial values used by Gazebo.
Important Notes
-
The four methods described above are independent and ignorant of each other. In particular, the settings seen in Gazebo's Physics tab will not reflect changes made dynamically by other methods.
-
These settings rely on the use of ROS simulation time, and not system time or another time source. The use of ROS time is specified as a launch parameter as follows.
<param name="/use_sim_time" value="true"/>