A tool to create pixel-accurate energy diagrams as ChemDraw object.
A Chinese version of this article is available.
If you don't have Python environment, there is an executable version (packed by cx_freeze on Windows 10) in the release. Run Draw_Energy_Diagram_XML.exe in the folder.
Alternatively, if you have a Python environment with PyQt, openpyxl and matplotlib, call the main script by first cd / dir to the project folder and call:
python Draw_Energy_Diagram_XML.py. (On windows, you can also just double click Draw_Energy_Diagram_xml.bat)
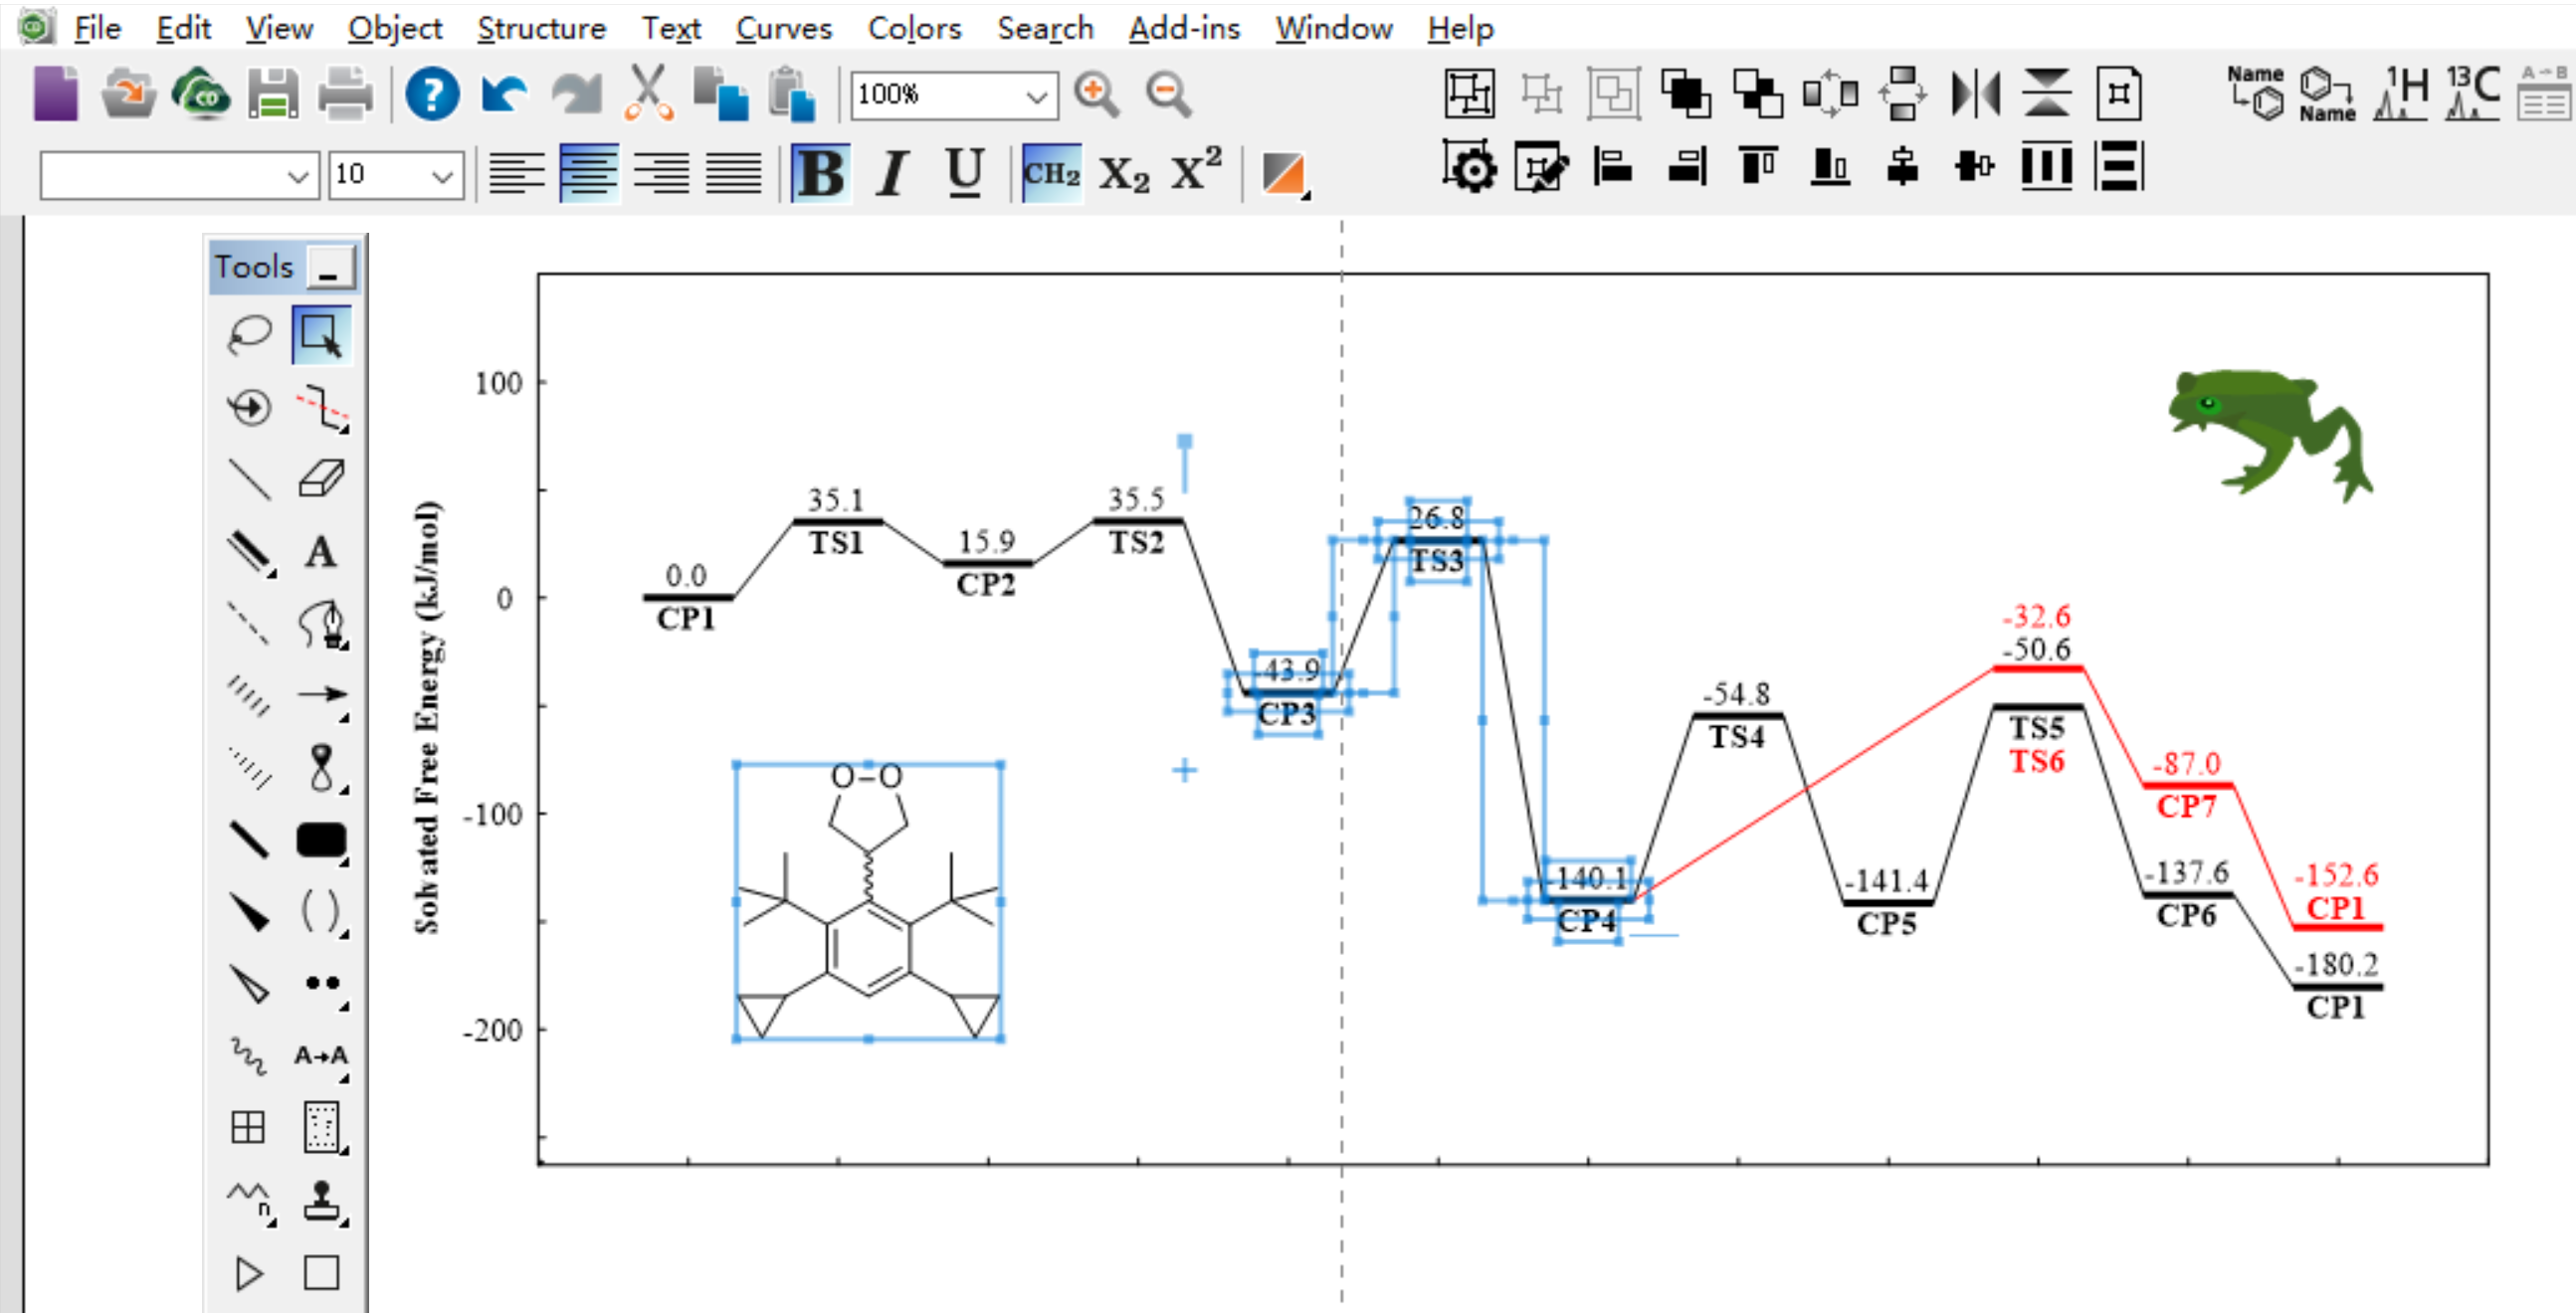
In the literatures, I see lots of people use the ChemDraw+mouse+eye method to draw energy diagrams. It is tedious and sometimes extremely inaccurate. Sometimes even the qualitative order breaks down, which could be very misleading. As an example, the left figure below is from a literature which is clearly drawn manually in ChemDraw, and the right is the to-scale version (ignore the unit change from kcal/mol to kJ/mol). The original diagram is a mess. Such diagrams are even worse than only giving numbers as a table.
There are lots of tools to generate energy diagrams. For example, DataGraph or mechaSVG. They are OK for basic graphs, but they usually generate an un-editable figure with very limited customization options. Also, one cannot drag the numbers and tags, which is troublesome for complex energy diagrams.
The program here can automatically generate ChemDraw files with line charts based on simple Excel input. After that, you can freely modify it in ChemDraw. And it's very convenient to add chemical structure:
Below is the input file format. By comparing left to right, it should be easy to understand. I also give several other examples in this repo:
For color definition, you can use any color for each state with its RGB value #XXXXXX. The colors below it can also be used with y,m,c,r,g,b (top to bottom).:
The overall GUI structure and the meaning of each option are described in the following figures (You can also hover on the options to see a tooltip):
(The font of the figure is fixed to Arial (you can change it later in ChemDraw), and the canvas size and aspect ratio of the figure are determined by the window size.)
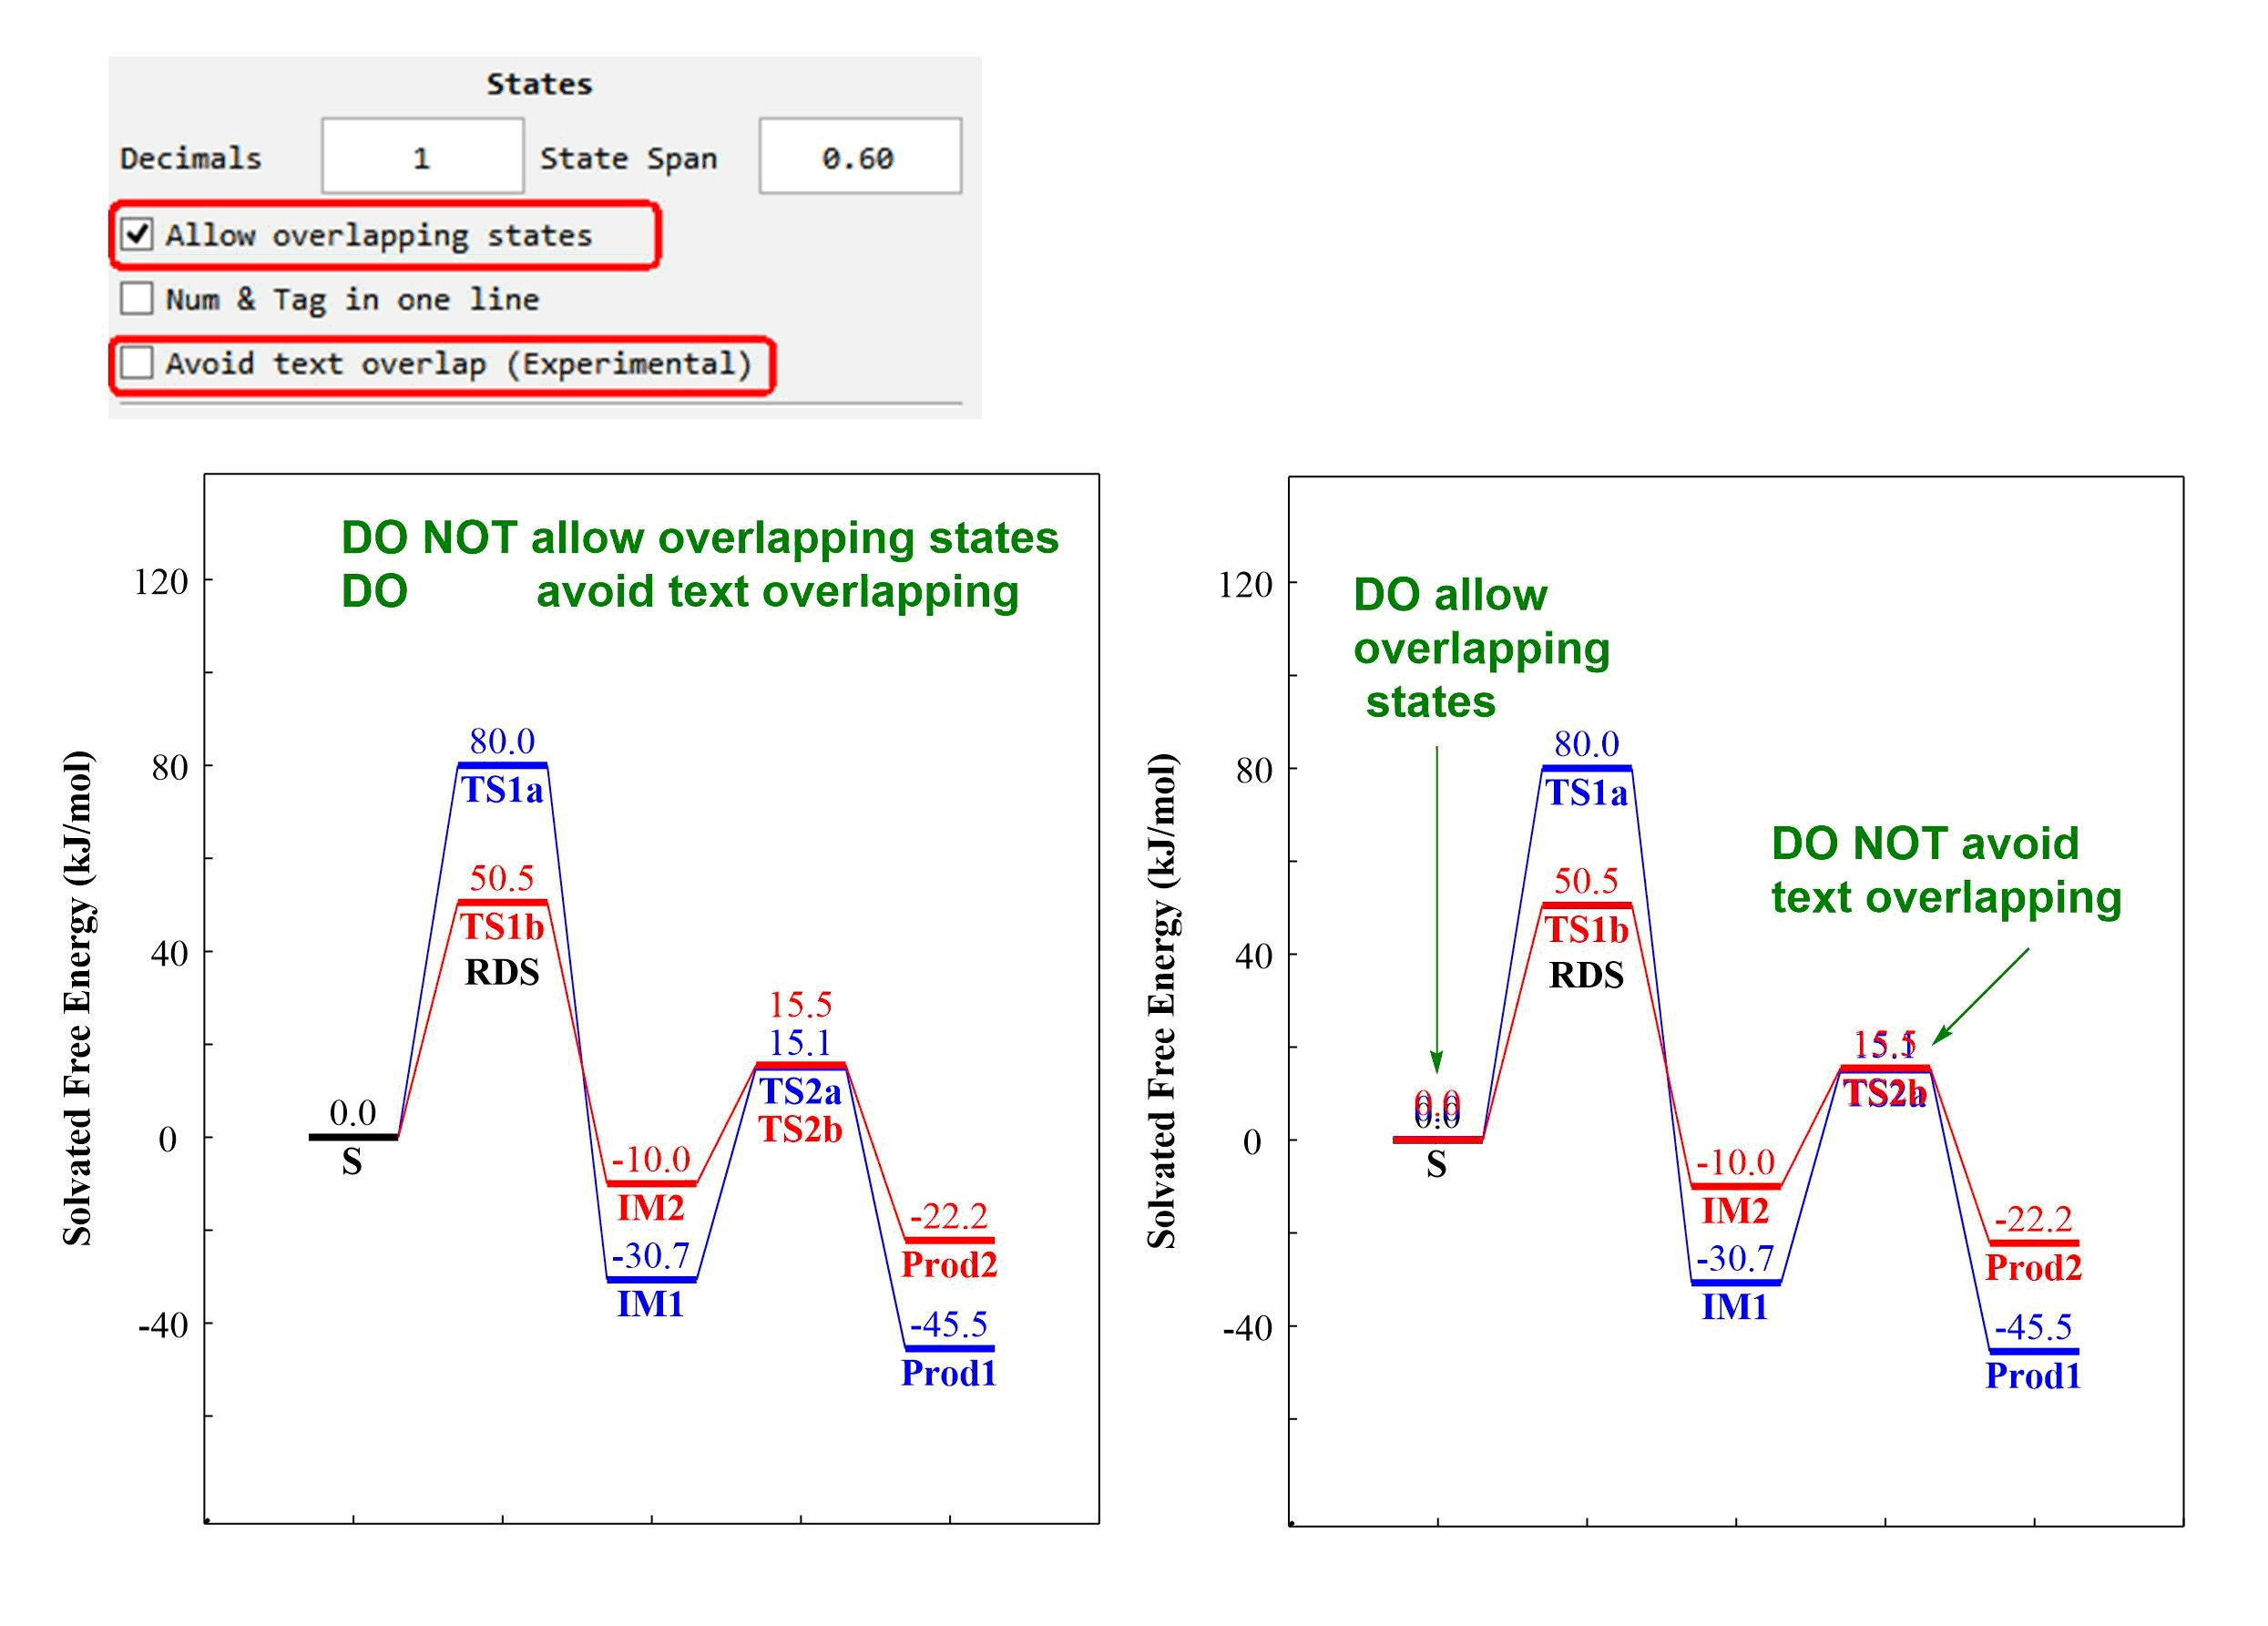
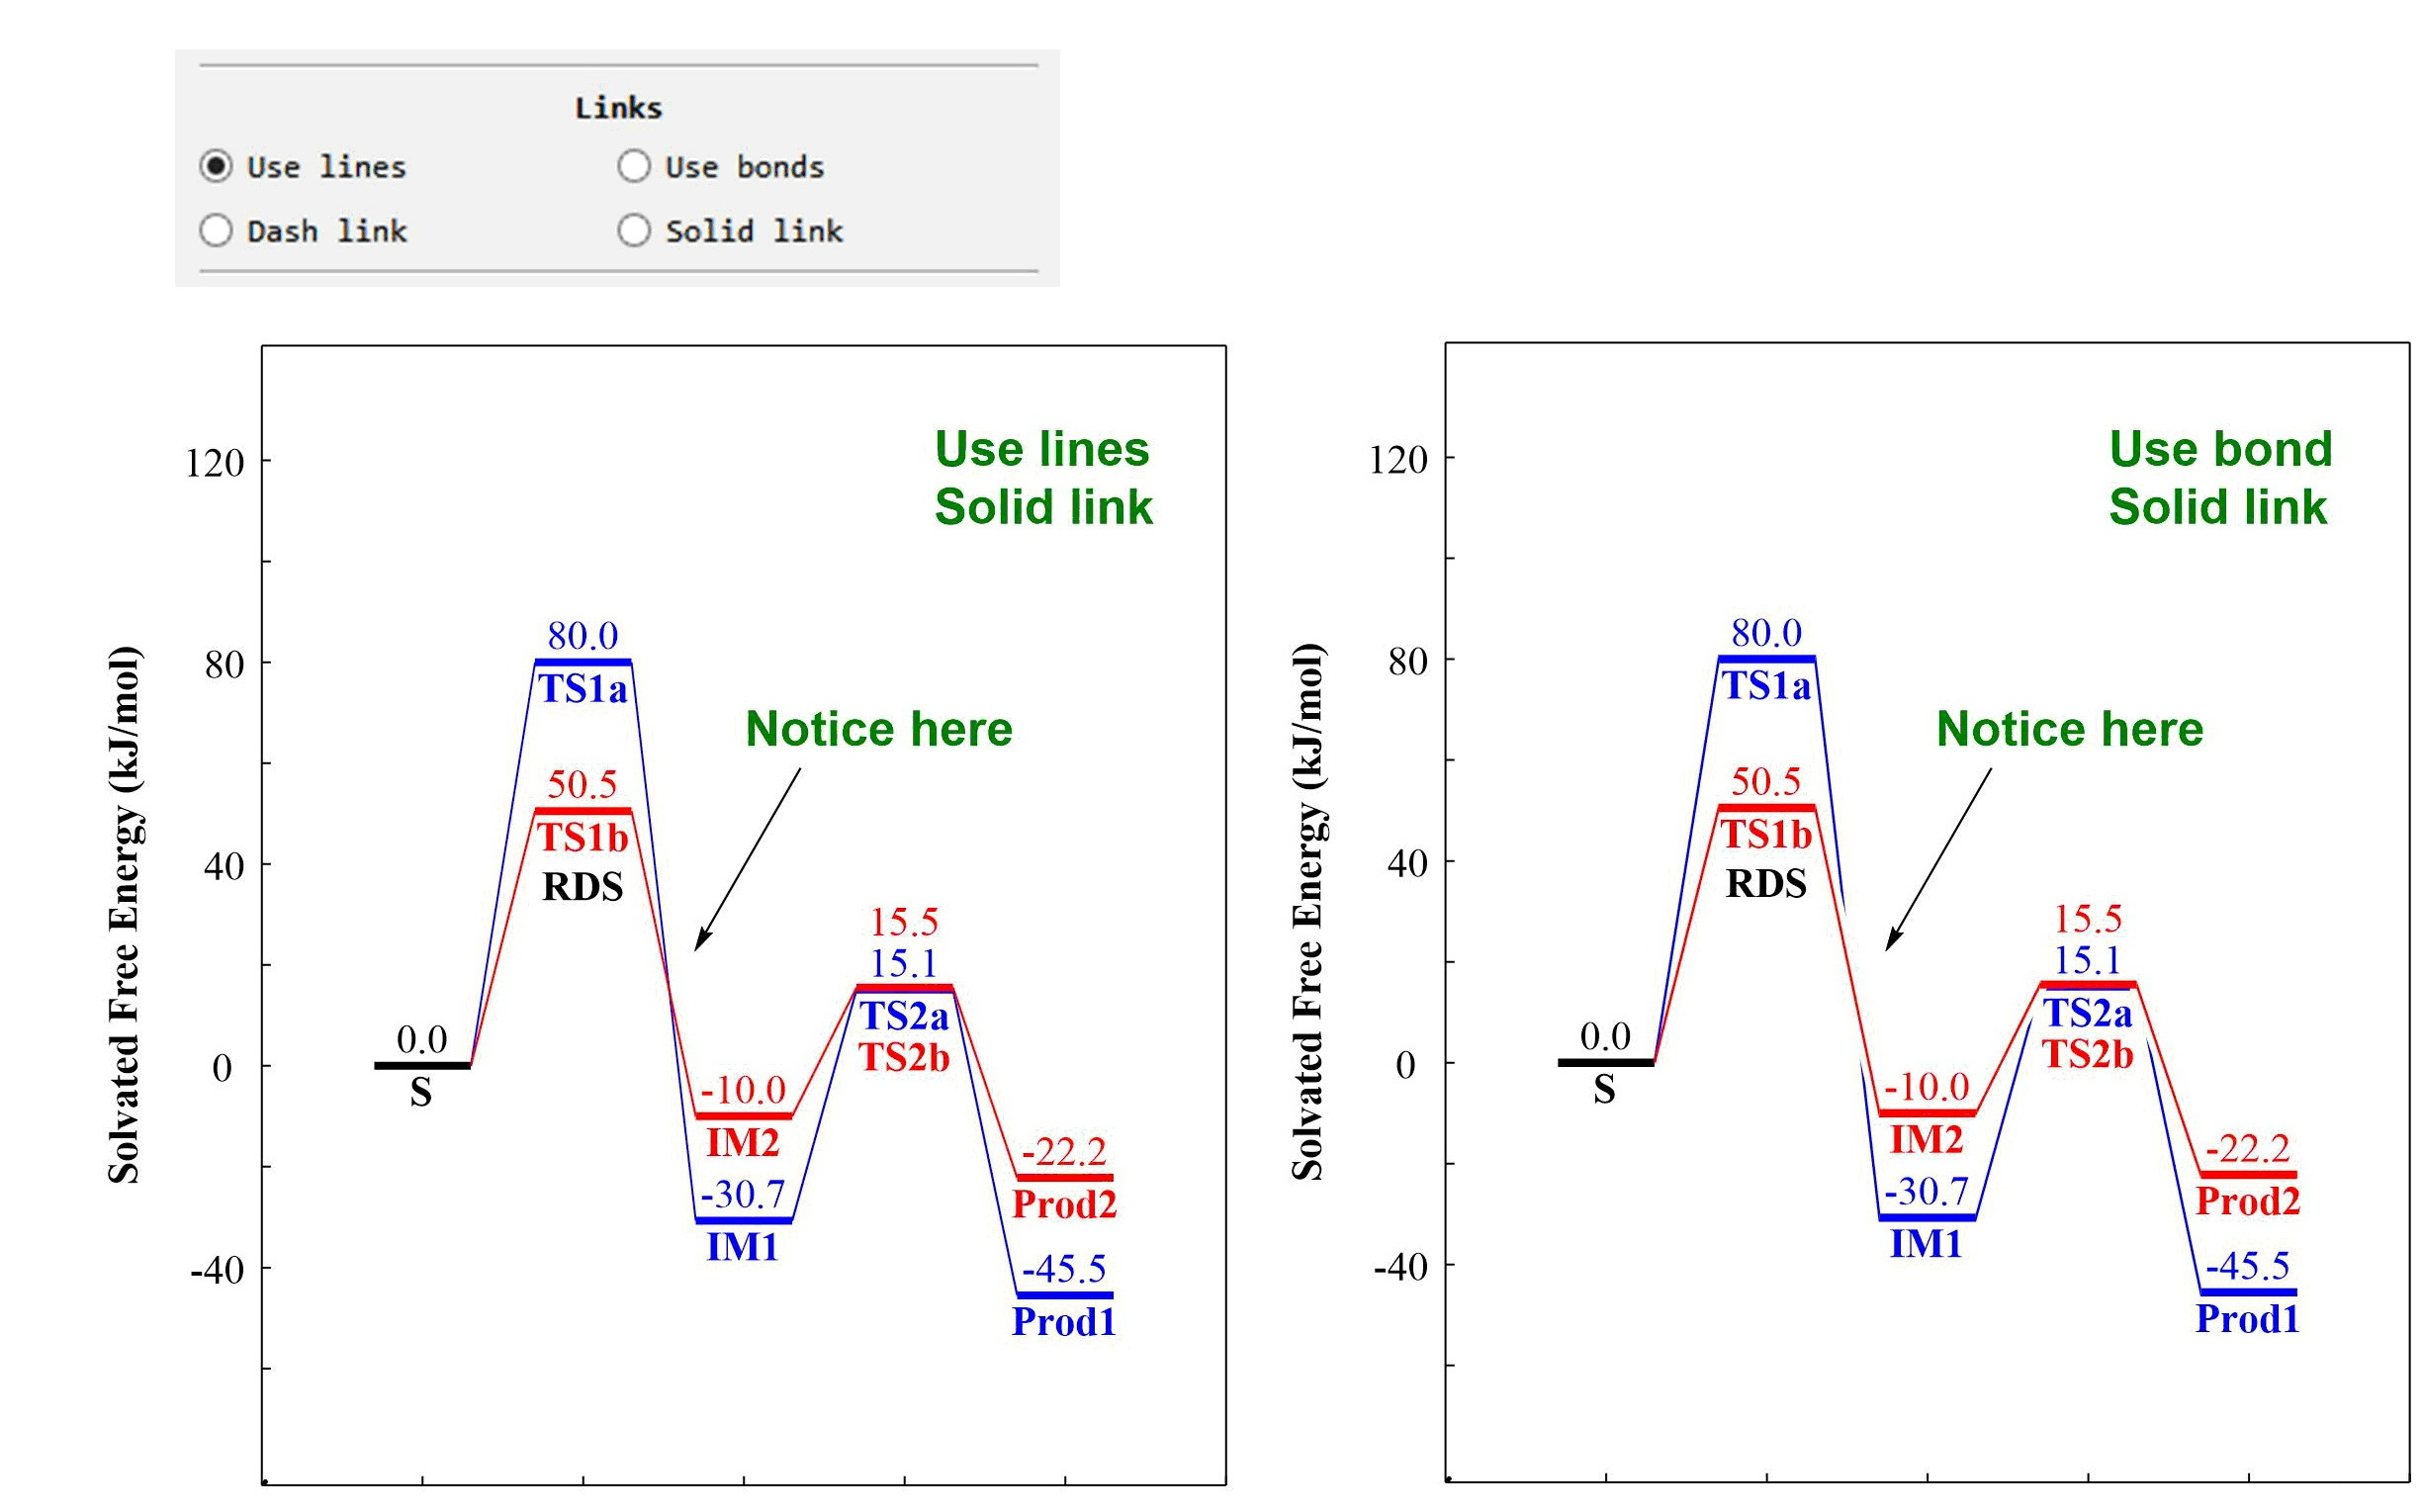
Here are some visuals for each option. Note that some of the following options are only reflected in the ChemDraw file, not in the preview view:
The last "Use temp file" option is to decide whether the program creates a file in its own Temp folder (the user needs to save it after viewing it), or directly generates a cdx file in the directory where Excel is located.
Other options not mentioned should be self-explanatory.
The temporary files of the program are stored in the program directory, so the program must have read and write permissions to this directory. It is not recommended to put the program in a path with permission restrictions such as Program Files, otherwise please give it administrator permissions.
The preview interface is not completely correct. If there is unexpected behavior, export the ChemDraw file first to see if it is normal.
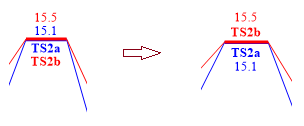
The "Avoid text overlap" function is currently a greedy algorithm, and may produce unreasonable results in particularly crowded situations. Just fine-tune it yourself (tip, hold down Shift and drag the text in ChemDraw to ensure it moves horizontal or vertical).
If you encounter some unexpected behavior, please try to run the examples first and see whether it's a problem of your input or my program.
After that, you can give feedback by upload your Excel input file, a screenshot of the operation interface before crashing and the last display in the CMD window. If the output file is generated, but there is a problem with the output file, please upload the output file as well.
If there is a crash, please run the program through the "Draw_Energy_Diagram_XML_Debug.bat" file in the directory, to keep the error message before the program exits.


