Assess impact of watch cache on large production cluster (5k+ namespaces) #16112
Comments
|
The watch cache benefits the api server by avoiding decodes from etcd (CPU+garbage), and some by collapsing common watches. It functions best when Endpoints and pods are high write, high N, and high clients. Nodes are high write, small N (mostly) and small C. Most other resources are either low write or low client, where the memory use is a wash. I think the recommendation should be that on dense clusters only resources that hit |
|
Ran 1k simultaneous endpoint watches (ramping up over 2 minutes), where endpoints are changing at a rate of 22 writes a second). Observed memory increase, but did not stay consistently high. No CPU impact was observed. A 40-60% reduction in master memory with only a small amount of CPU increase for disabling the watch cache for the majority of resources seems a desirable tradeoff. |
|
@openshift/sig-scalability |
|
What about other resources? Disk I/O, network, and sockets? How might this affect performance in a partitioned scenario? |
|
Network was the same, sockets was the same, disk/io needs to be measured. We use HTTP/2 to backend etcd so it's all multiplexed. Define partitioned. |
|
By that I meant ... any implications that differ in a single master vs multi-master scenario. I see your resource graphs but ... what were the latencies all along the histogram (not just tail)? I ask because you are saying that the watch cache for (most) resources buys us nothing until we have a certain scale, and you're optimizing for reduced memory usage in the common case. As long as there is supporting data, this makes sense to me. It would be good to have the data supporting this included in the BZ here. The side-effect of this proposed change is needing to document how to identify when a cluster would benefit from more watch caches, how to enable them (and which to enable), and how to calculate memory requirements for enabling watch caches down the line. |
|
There was no change in latency tails. We're going to try the whole cluster tomorrow and will gather that. I don't expect an IO change but will look. |
|
Whole cluster conversion, RSS for masters on core services Whole cluster converted, in use heap on api-servers
Master CPU over longer period (core services) No change to etcd write volume. |


|
99th percentile latency did not change significantly. |
Automatic merge from submit-queue (batch tested with PRs 16546, 16398, 16157)

Backport upstream changes to watch cache enablement

Disables the watch cache for most resources by default, except those accessed by many clients. This has been shown to have minor impacts on the production workload.

Fixes #16112
On a large dense cluster memory use of the api server is of primary concern (for scale) due to the watch cache keeping copies of all objects in memory. We conducted a test on a cluster to assess the impact of disabling the watch cache.
Scenario:
CPU over time for that master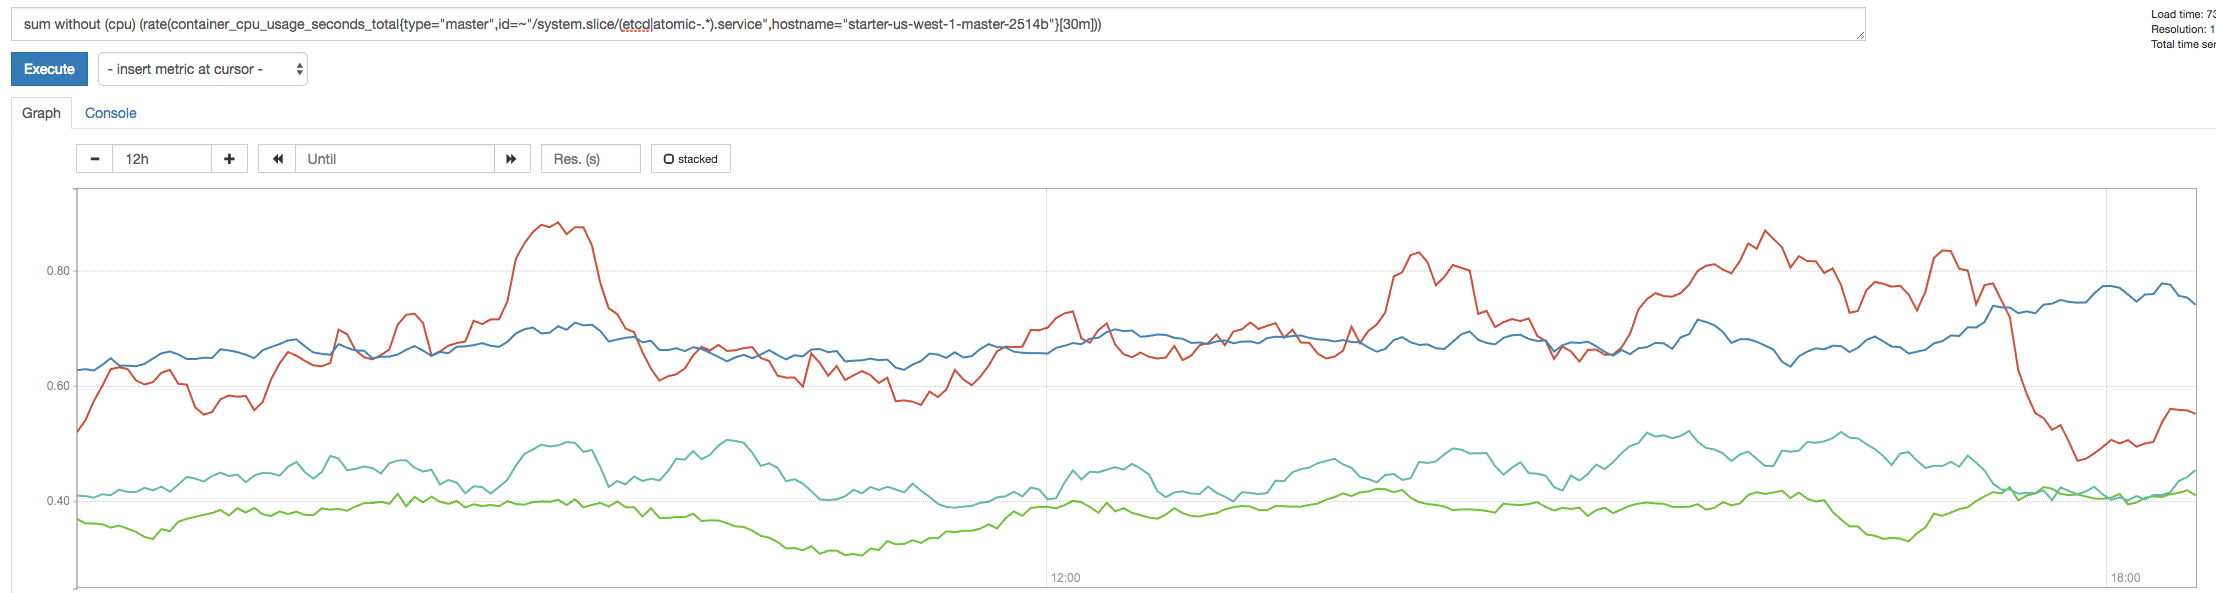 (red is apiserver, blue is etcd)
RSS for that master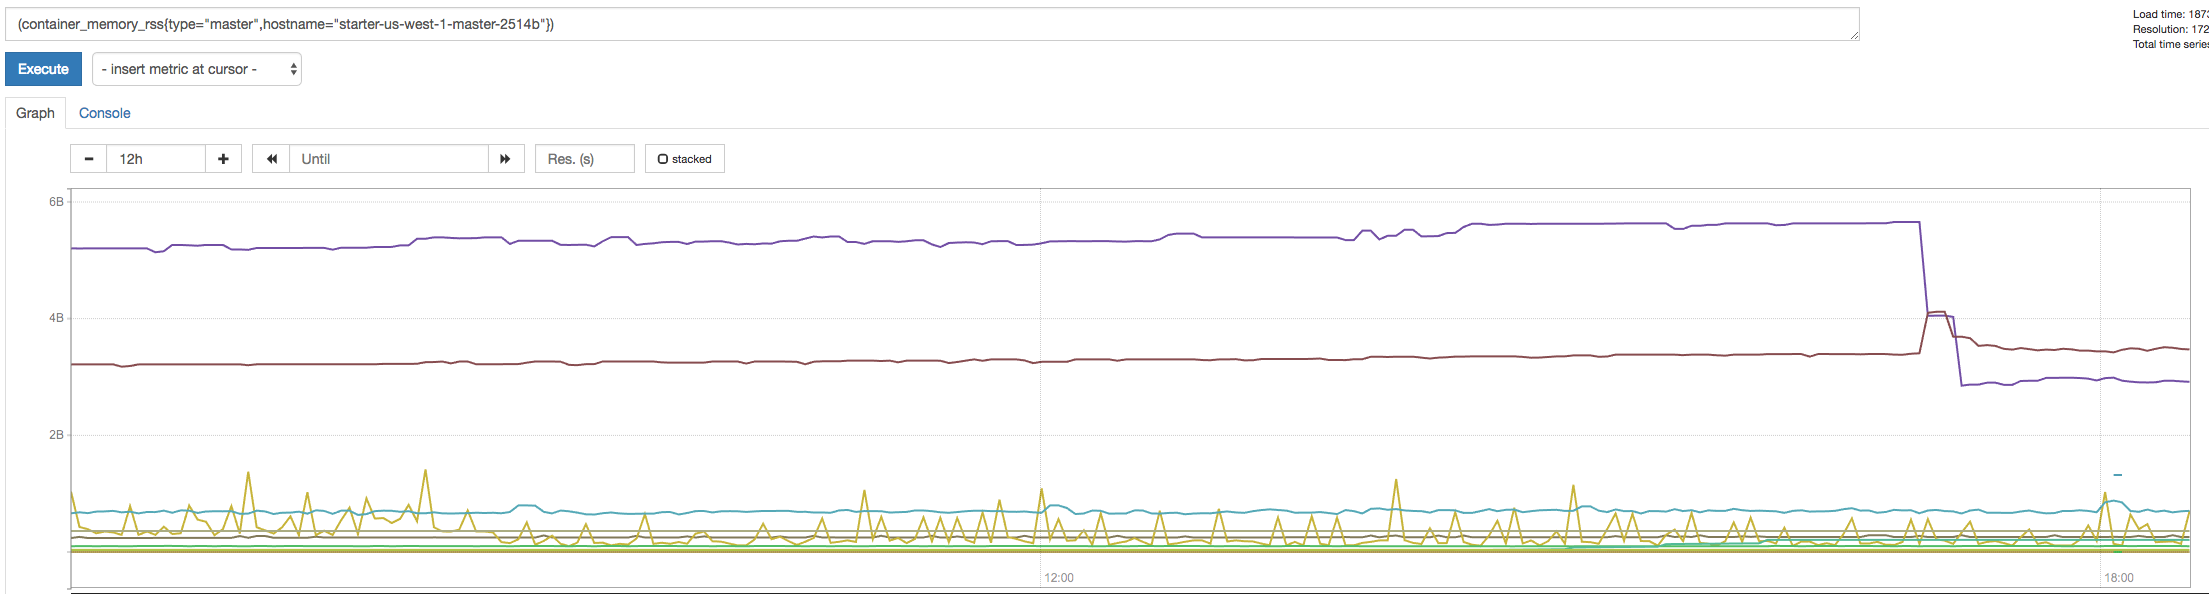 (purple is apiserver, brown is controller)
Internal go heap stats for all masters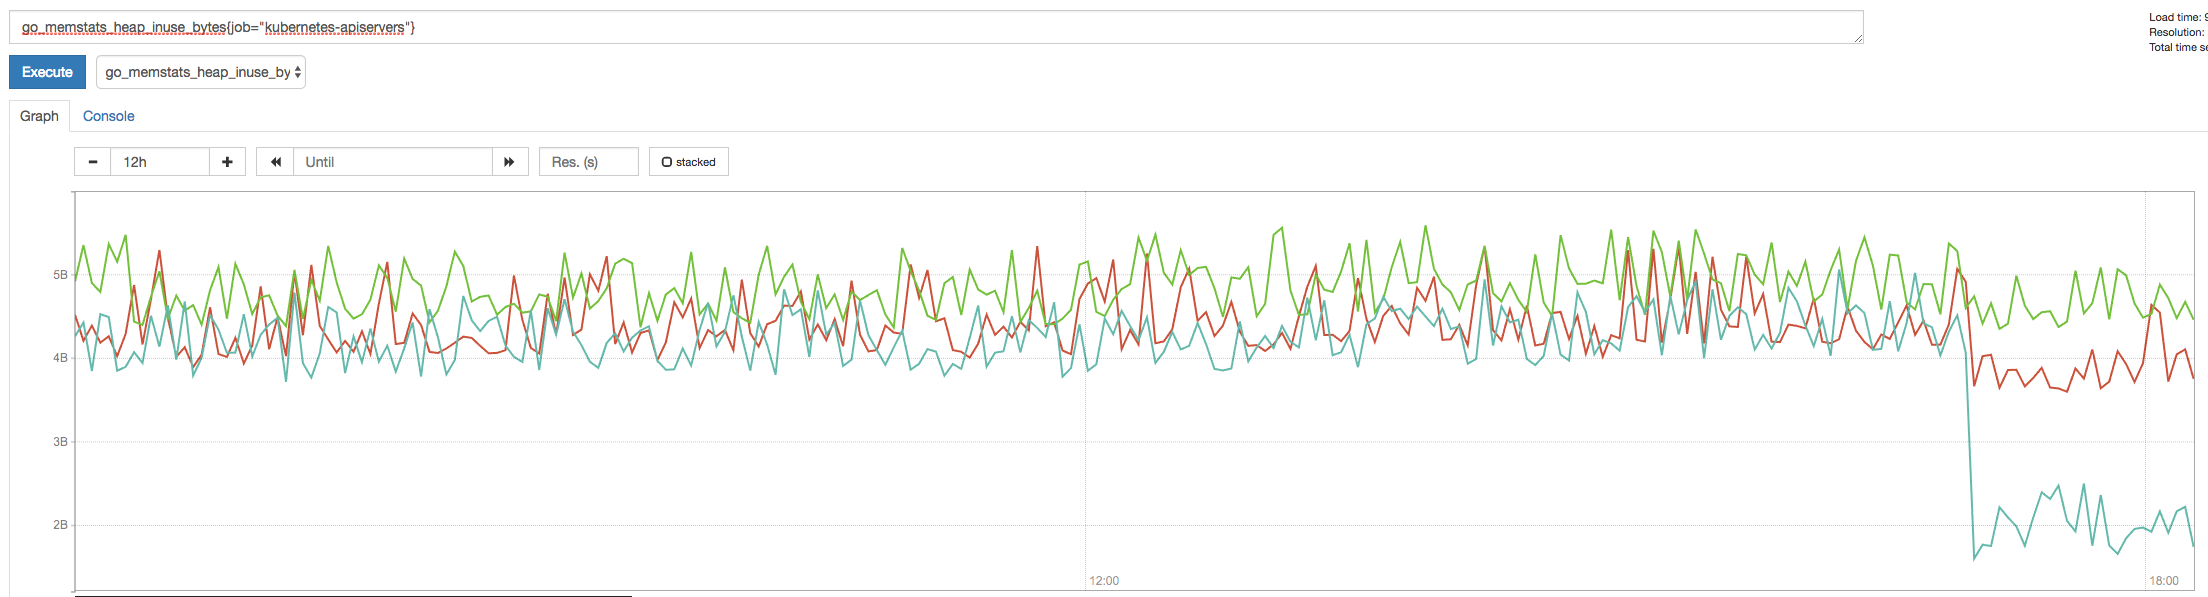
No observed change to tail latency. Still measuring impact to CPU vs number of small watches
The text was updated successfully, but these errors were encountered: