-
-
Notifications
You must be signed in to change notification settings - Fork 18k
New issue
Have a question about this project? Sign up for a free GitHub account to open an issue and contact its maintainers and the community.
By clicking “Sign up for GitHub”, you agree to our terms of service and privacy statement. We’ll occasionally send you account related emails.
Already on GitHub? Sign in to your account
Add colormap= argument to DataFrame plotting methods #3860
Conversation
|
I like this:+1: on the idea of extending plotting. That said, I'm hoping long-term we follow the matplotlib convention and pass all extra kwargs to the OOP interface of matplotlib (in other words, if you get Btw - What should happen when you pass an invalid colormap? |
|
That said, I think this is a great addition! |
|
@jtratner My impression is that As for what happens when you pass a string that does not correspond to a matplotlib colormap, you just get matplotlib's error: |
|
@qwhelan Thanks for clarifying on this :), didn't realize that this wasn't a straight to mpl case. Can you add a test case for the failure condition? |
|
@jtratner Done. I've worked out my Sphinx issue, but it'll be a few days before I can get back to it. I can do that in a separate pull if that's more convenient. |
|
@qwhelan thanks for adding that test in. in regards to your question - probably easier to just include the changes with this pull request. |
|
I think it's natural to pass any option for is not specifically picked by pandas directly to matplotlob of course pandas can be smarter and intercept certain arguments but that is a different issue |
|
@jreback, no, as @qwehelan points out, you have to manipulate the axis directly to do it. I do think it makes the graphs far more visually appealing. |
|
we can push to 0.12 though I don't see any harm in adding now |
|
your call - might be better to push to 0.12, in case there are other plotting changes... |
|
@jtratner I've added some documentation to the visualization.rst page. I don't have any further changes planned. |
|
Thanks... I meant more along the lines of broader changes to plotting.
|
|
@jtratner Sorry for the confusion, I wasn't responding to your previous post. I was following up on the comment I made several days ago regarding additional changes to this pull request. |
|
I am fine with this...there might be other changes to plotting in 0.12, but this is 'independent' AFAIK... can you rebase on current master? |
|
is this compatible with mpltools? |
|
why not call it |
|
@cpcloud Should be compatible, colors are being generated the exact same way. The only difference is that mpltools calls As for |
|
@qwhelan can u rebase? |
|
@qwhelan can you hook up to travis? (see contributing in main pandas dir) pls also add a release notes entry and in v0.11.1 (will be changed to 0.12 - as thats going to be the release version, but not merged yet) and then squash down commits to a few thanks |
|
@qwhelan trying to close out issues for 0.12...status of the above? |
|
alternatively we could push to 0.13... |
|
this just needs release notes and entry in 0.12 and test on travis... |
|
i'm running the branch on travis |
|
ok...perfect |
|
Thanks. I can take care of the squash/release notes by 8pm PST.
|
|
@qwhelan great... you will need to rebase to master first (and see if you can setup travis for the future in any event) |
Refactor color and colormap option handling

Add tests for colormap=

Add tests for colormap=

Add colormap documentation to visualization.rst

Add release notes
|
@jreback Added release notes, squashed, and travis is passing. Should be good to go. |
Add colormap= argument to DataFrame plotting methods
|
looks great |
I frequently plot DataFrames with a large number of columns and generally have difficulty distinguishing series due to the short cycle length of the default color scheme.
Especially in cases where the ordering of columns has significant information, the ideal way to color the series would be with a matplotlib colormap that uniformly spaces colors. This is pretty straightforward with pyplot, but pretty annoying to have to repeatedly do.
This patch modifies DataFrame plotting functions to take a
colormap=argument consisting of either astrname of a matplotlib colormap or a colormap object itself.KDE plot:
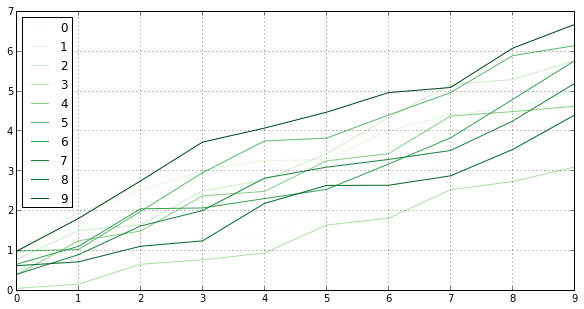
Some colormaps don't work as well on a white background (the 0 column is white):

df.cumsum().plot(colormap=cm.Greens, figsize=(10,5))
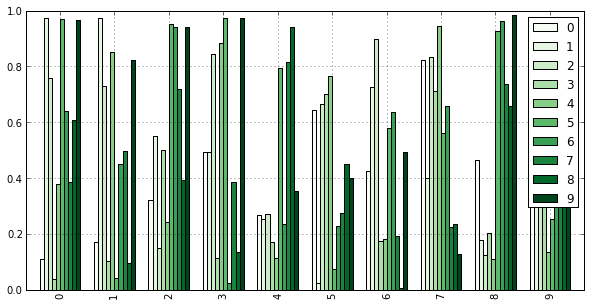
But work better for other graph types:

df.plot(kind='bar', colormap='jet', figsize=(10,5))
Parallel coordinates on the iris dataset:
Andrews curves (I'd appreciate someone double checking this one; don't think I have it quite right):
I've included some test coverage and unified all the color creation code into one method
_get_standard_colors(). I started adding to the documentation but ran into a weird issue with the sphinx plot output. When adding this tovisualization.rst:I get this output (the lines should be white->green):

My first thought was that it was the
options.display.mpl_style = 'default', but plots render fine in IPython with this setting. My guess is something in@savefig, but is anyone familiar with what might be happening here?