Skip to content
This repository has been archived by the owner on Jun 4, 2024. It is now read-only.

Allow HTML content in Markdown cells #916

Merged
merged 3 commits into from
Jun 28, 2021

Conversation

AnnMarieW
Copy link
Contributor

@AnnMarieW AnnMarieW commented Jun 28, 2021

closes #915
closes #800

This pull request allows for the use html tags in markdown text.

As discussed here in in #915 DataTable uses Remarkable for its markdown and the default is set to disable html input, probably to reduce XSS vulnerabilities. This PR adds the html option to markdown_options prop to make it possible to "opt in" and allow html in markdown.

I found this reported security issue with Remarkable which was fixed in 2019 in version 1.7.2. DashTable currently uses version ^2.0.1. I'm not sure I understand the XSS risks -- I think this would be a good topic to include in the docs. Would there be less risk if the markdown columns are not editable when html is allowed?

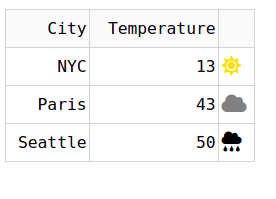
Also for the docs, here is some good info about using html with markdown, and below are 3 examples to show some of the new features:

  • Using Font Awesome icons
  • Changing the color of icons with conditional formatting
  • Using html to format text
  • Including images in markdown

Examples

Font Awesome Icons <i>
image

import dash
import dash_html_components as html
import dash_table
import pandas as pd


FONT_AWESOME = "https://use.fontawesome.com/releases/v5.10.2/css/all.css"

clouds = '<i class="fa fa-cloud" style="color: grey;"></i>'
rain = '<i class="fa fa-cloud-rain"></i>'
sun = '<i class="fa fa-sun" style="color: gold;"></i>'

app = dash.Dash(__name__, external_stylesheets=[FONT_AWESOME])

df = pd.DataFrame(
    dict(
        [
            ("temperature", [13, 43, 50]),
            ("city", ["NYC", "Paris", "Seattle"]),
            ("icon", [sun, clouds, rain]),
        ]
    )
)

app.layout = html.Div(
    [
        dash_table.DataTable(
            css=[dict(selector="p", rule="margin: 0px;")],
            data=df.to_dict("records"),
            columns=[
                {"id": "city", "name": "City"},
                {"id": "temperature", "name": "Temperature"},
                {"id": "icon", "name": "", "presentation": "markdown"},
            ],
            markdown_options={"html": True},
            style_table={"width": 200},
        )
    ]
)

if __name__ == "__main__":
    app.run_server(debug=True)

Change Color of Icons with Conditional Formatting
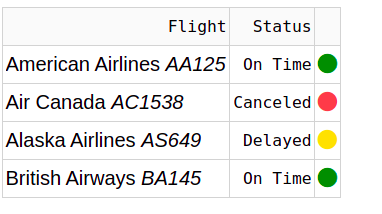
Formatting text with html

image

import dash
import dash_html_components as html
import dash_table
import pandas as pd


FONT_AWESOME = "https://use.fontawesome.com/releases/v5.10.2/css/all.css"

dot = '<i class="fa fa-circle" ></i>'

app = dash.Dash(__name__, external_stylesheets=[FONT_AWESOME])

df = pd.DataFrame(
    dict(
        [
            (
                "flight",
                [
                    "American Airlines <em>AA125</em>",
                    "Air Canada <em>AC1538</em>",
                    "Alaska Airlines <em>AS649</em>",
                    "British Airways <em>BA145</em>",
                ],
            ),
            ("status", ["On Time", "Canceled", "Delayed", "On Time"]),
            ("icon", [dot, dot, dot, dot]),
        ]
    )
)

app.layout = html.Div(
    [
        dash_table.DataTable(
            css=[dict(selector="p", rule="margin: 0px;")],
            data=df.to_dict("records"),
            columns=[
                {"id": "flight", "name": "Flight", "presentation": "markdown"},
                {"id": "status", "name": "Status"},
                {"id": "icon", "name": "", "presentation": "markdown"},
            ],
            markdown_options={"html": True},
            style_table={"width": 200},
            style_data_conditional=[
                {
                    "if": {
                        "filter_query": '{status} = "Canceled"',
                        "column_id": "icon",
                    },
                    "color": "tomato",
                },
                {
                    "if": {"filter_query": '{status} = "Delayed"', "column_id": "icon"},
                    "color": "gold",
                },
                {
                    "if": {"filter_query": '{status} = "On Time"', "column_id": "icon"},
                    "color": "green",
                },
            ],
        )
    ]
)

if __name__ == "__main__":
    app.run_server(debug=True)

Adding images using the html tag. This can make it easier to control image size and add other style.

image

import dash
import dash_html_components as html
import dash_table
import pandas as pd

seattle = "<img src='https://upload.wikimedia.org/wikipedia/commons/2/23/Space_Needle_2011-07-04.jpg' height='75' />"
paris = "<img src='https://upload.wikimedia.org/wikipedia/commons/a/a8/Tour_Eiffel_Wikimedia_Commons.jpg' height='75' />"
nyc = "<img src='https://upload.wikimedia.org/wikipedia/commons/d/dd/Lady_Liberty_under_a_blue_sky_%28cropped%29.jpg' height='75' />"


app = dash.Dash(__name__)

df = pd.DataFrame(
    dict(
        [
            ("temperature", [13, 43, 50]),
            ("city", ["NYC", "Paris", "Seattle"]),
            ("image", [nyc, paris, seattle]),
        ]
    )
)

app.layout = html.Div(
    [
        dash_table.DataTable(
            css=[dict(selector="p", rule="margin: 0px;")],
            data=df.to_dict("records"),
            columns=[
                {"id": "image", "name": "", "presentation": "markdown"},
                {"id": "city", "name": "city"},
                {"id": "temperature", "name": "temperature"},
            ],
            markdown_options={"html": True},
            style_table={"width": 200},
        )
    ]
)

if __name__ == "__main__":
    app.run_server(debug=True)

Copy link
Collaborator

@alexcjohnson alexcjohnson left a comment

Choose a reason for hiding this comment

The reason will be displayed to describe this comment to others. Learn more.

💃 after considering #916 (comment)

Add XSS vulnerability warning

Co-authored-by: Alex Johnson <johnson.alex.c@gmail.com>
@alexcjohnson alexcjohnson merged commit 0a4acf5 into plotly:dev Jun 28, 2021
@AnnMarieW AnnMarieW deleted the markdown-html branch June 28, 2021 19:25
@leandrofomtana
Copy link

Would it be possible to add javascript to the inside of the cell? So it can be used as buttons that interact with the data

Sign up for free to subscribe to this conversation on GitHub. Already have an account? Sign in.
Labels
None yet
Projects
None yet
Development

Successfully merging this pull request may close these issues.

Allow HTML content in Markdown cells Table of images or thumbnails please ??
4 participants