- exBERT
- BertViz
- CNN Explainer
- Play with GANs in the Browser
- ConvNet Playground
- Distill: Exploring Neural Networks with Activation Atlases
- A visual introduction to Machine Learning
- Interactive Deep Learning Playground
- Initializing neural networks
- Embedding Projector
- OpenAI Microscope
- Sage Interactions
- Probability Distributions
- Bayesian Inference
- Seeing Theory: Probability and Stats
- Interactive Gaussian Process Visualization
"exBERT is a tool to help humans conduct flexible, interactive investigations and formulate hypotheses for the model-internal reasoning process, supporting analysis for a wide variety of Hugging Face Transformer models. exBERT provides insights into the meaning of the contextual representations and attention by matching a human-specified input to similar contexts in large annotated datasets."
- Source: exBERT
"BertViz is a tool for visualizing attention in the Transformer model, supporting most models from the transformers library (BERT, GPT-2, XLNet, RoBERTa, XLM, CTRL, MarianMT, etc.). It extends the Tensor2Tensor visualization tool by Llion Jones and the transformers library from HuggingFace."
- Source: BertViz
An interactive visualization system designed to help non-experts learn about Convolutional Neural Networks (CNNs). It runs a pre-tained CNN in the browser and lets you explore the layers and operations.
Explore Generative Adversarial Networks directly in the browser with GAN Lab. There are many cool features that support interactive experimentation.
- Interactive hyperparameter adjustment
- User-defined data distribution
- Slow-motion mode
- Manual step-by-step execution
ConvNet Playground is an interactive visualization tool for exploring Convolutional Neural Networks applied to the task of semantic image search.
Feature inversion to visualize millions of activations from an image classification network leads to an explorable activation atlas of features the network has learned. This can reveal how the network typically represents some concepts.
Available in many different languages.
New to Deep Learning? Tinker with a Neural Network in your browser.
Initialization can have a significant impact on convergence in training deep neural networks. Simple initialization schemes can accelerate training, but they require care to avoid common pitfalls. In this post, deeplearning.ai folks explain how to initialize neural network parameters effectively.
It's increaingly important to understand how data is being interpreted by machine learning models. To translate the things we understand naturally (e.g. words, sounds, or videos) to a form that the algorithms can process, we often use embeddings, a mathematical vector representation that captures different facets (dimensions) of the data. In this interactive, you can explore multiple different algorithms (PCA, t-SNE, UMAP) for exploring these embeddings in your browser.
The OpenAI Microscope is a collection of visualizations of every significant layer and neuron of eight important vision models.
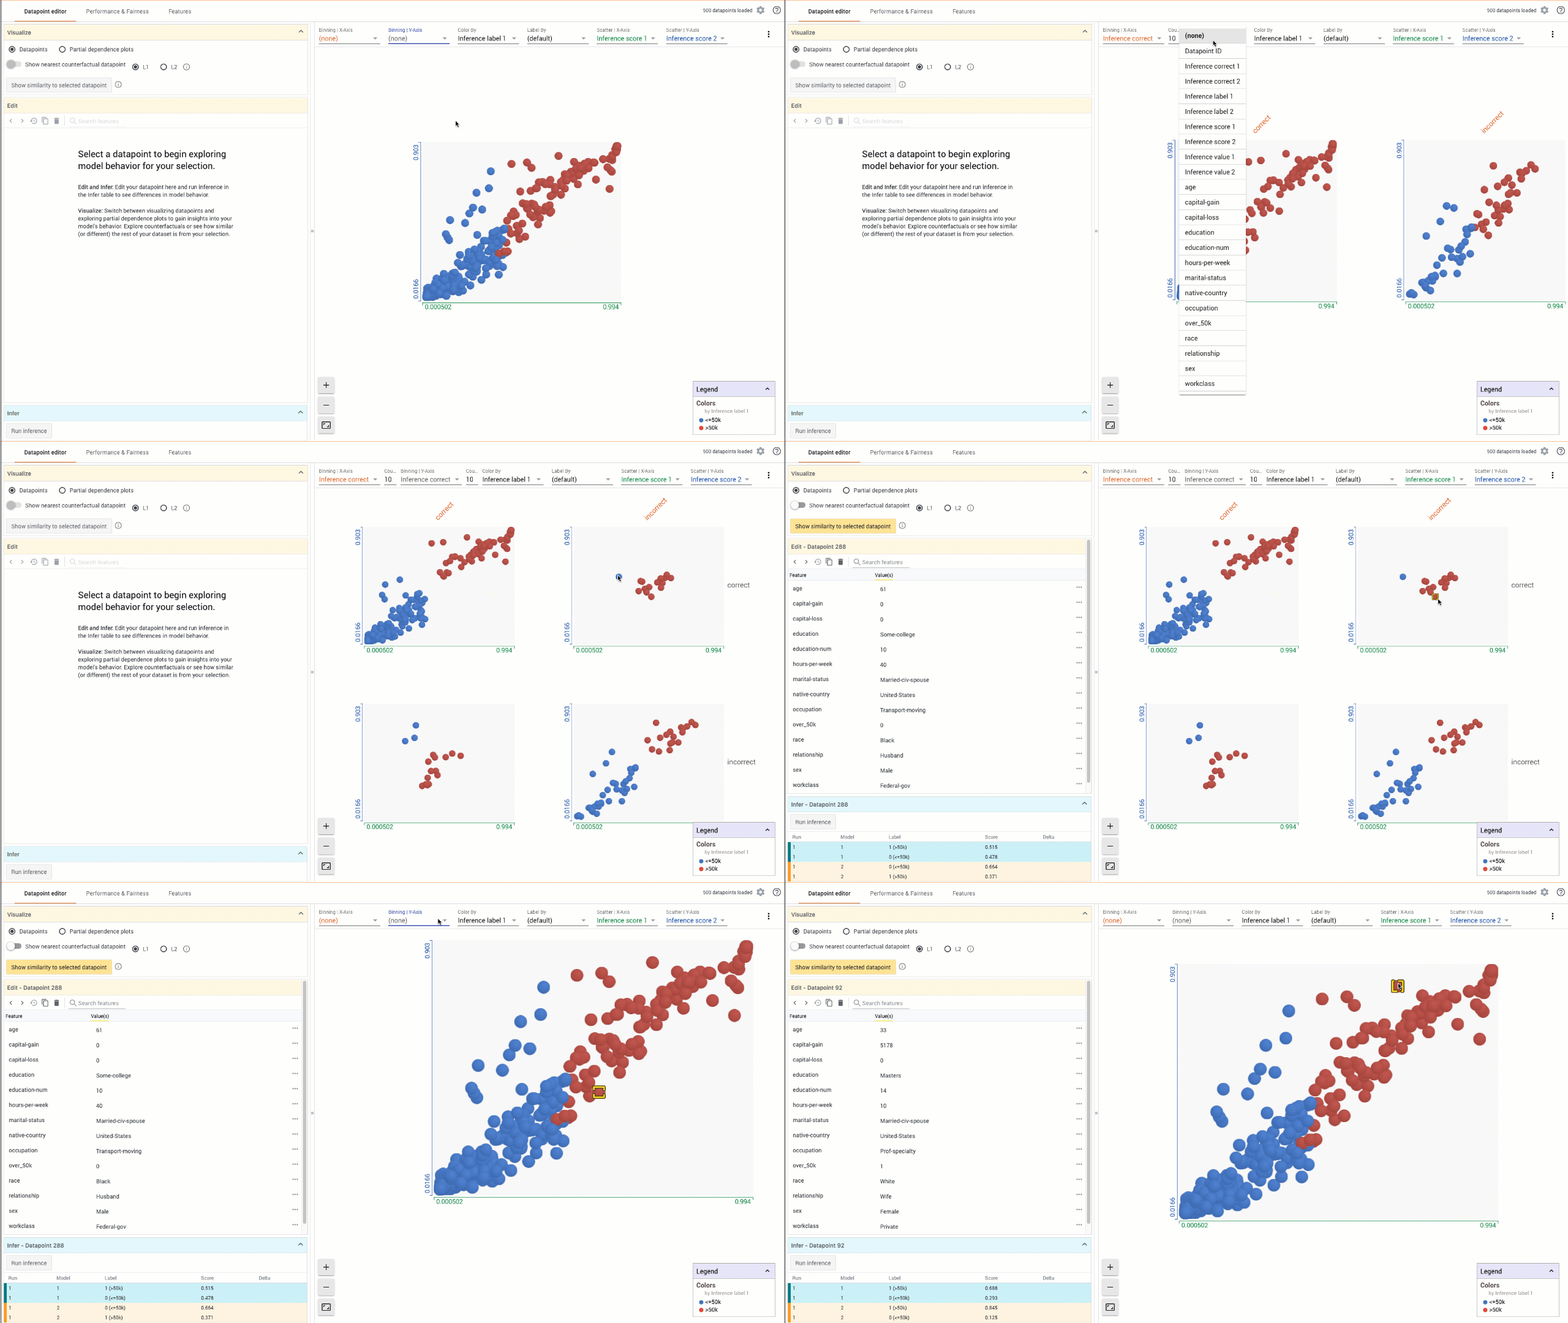
The Language Interpretability Tool (LIT) is an open-source platform for visualization and understanding of NLP models.
You can use LIT to ask and answer questions like:
- What kind of examples does my model perform poorly on?
- Why did my model make this prediction? Can it attribute it to adversarial behavior, or undesirable priors from the training set?
- Does my model behave consistently if I change things like textual style, verb tense, or pronoun gender?
The What-If Tool lets you visually probe the behavior of trained machine learning models, with minimal coding.
PAIR Explorables around measuring diversity.
"Search, ranking and recommendation systems can help find useful documents in large datasets. However, these datasets reflect the biases of the society in which they were created and the systems risk re-entrenching those biases. For example, if someone who is not a white man searches for “CEO pictures” and sees a page of white men, they may feel that only white men can be CEOs, further perpetuating lack of representation at companies’ executive levels."
-
Mitchell et. al. (2020) Diversity and Inclusion Metrics in Subset Selection
This is a collection of pages demonstrating the use of the interact command in Sage. It should be easy to just scroll through and copy/paste examples into Sage notebooks.
Examples include Algebra, Bioinformatics, Calculus, Cryptography, Differential Equations, Drawing Graphics, Dynamical Systems, Fractals, Games and Diversions, Geometry, Graph Theory, Linear Algebra, Loop Quantum Gravity, Number Theory, Statistics/Probability, Topology, Web Applications.
by Simon Ward-Jones. A visual 👀 tour of probability distributions.
- Bernoulli Distribution
- Binomial Distribution
- Normal Distribution
- Beta Distribution
- LogNormal Distribution
by Simon Ward-Jones. Explaining the basics of bayesian inference with the example of flipping a coin.
A visual introduction to probability and statistics.
"A Gaussian process can be thought of as an extension of the multivariate normal distribution to an infinite number of random variables covering each point on the input domain. The covariance between function values at any two points is given by the evaluation of the kernel of the Gaussian process. For an in-depth explanation, read this excellent distill.pub article and then come back to this interactive visualisation!"
- Source: Infinite curiosity


