Project Link: https://github.com/raviatkumar/Health-Insurance-Cross-Sell-Prediction/tree/main/deployment
Link:https:https://public.tableau.com/views/ravikumarHealth-Insurance-Cross-Sell-Prediction/Dashboard1?:language=en-US&:display_count=n&:origin=viz_share_link
Our client is an Insurance company that has provided Health Insurance to its customers now they need your help in building a model to predict whether the policyholders (customers) from the past year will also be interested in Vehicle Insurance provided by the company. An insurance policy is an arrangement by which a company undertakes to provide a guarantee of compensation for specified loss, damage, illness, or death in return for the payment of a specified premium. A premium is a sum of money that the customer needs to pay regularly to an insurance company for this guarantee.
For example, you may pay a premium of Rs. 5000 each year for a health insurance cover of Rs. 200,000/- so that if God forbid, you fall ill and need to be hospitalised in that year, the insurance provider company will bear the cost of hospitalisation, etc. for up to Rs. 200,000. Now if you are wondering how can the company bear such high hospitalisation costs when it charges a premium of only Rs. 5000/-, that is where the concept of probabilities comes into the picture. For example, like you, there may be 100 customers who would be paying a premium of Rs. 5000 every year, but only a few of them (say 2-3) would get hospitalised that year, and not everyone. This way everyone shares the risk of everyone else.
Just like medical insurance, there is vehicle insurance where every year a customer needs to pay a premium of a certain amount to the insurance provider company so that in case of an unfortunate accident by the vehicle, the insurance provider company will provide compensation (called ‘sum assured’) to the customer.
Building a model to predict whether a customer would be interested in Vehicle Insurance is extremely helpful for the company because it can then accordingly plan its communication strategy to reach out to those customers and optimise its business model and revenue.
Now, in order to predict whether the customer would be interested in Vehicle insurance, you have information about demographics (gender, age, region code type), Vehicles (Vehicle Age, Damage), Policy (Premium, sourcing channel), etc.

id: Unique ID for customer
Age: Age of the customer
Driving_License 0 : Customer has DL or not
Region_Code: Unique code for the region of the customer
Previously_Insured 1 : Customer already has Vehicle Insurance or not
Vehicle_Age: Age of the Vehicle
Vehicle_Damage 1 : Past damages present or not
Annual_Premium: The amount customer needs to pay as premium
PolicySalesChannel: Anonymized Code for the channel of outreaching to the customer ie. Different Agents, Over Mail, Over Phone, In Person, etc.
Vintage: Number of Days, Customer has been associated with the company
Response :Customer is interested or not
If a loss occurred a guarantee of compensation for specified loss, damage, illness, or death in return for the payment of a specified premium.
In insurance industry, it refers to a situation in which people only buy insurance when they expect high risks. Buying insurance is not appropriate for all levels and types of risks. In many cases, people are better off taking actions to avoid risk, retain (accept) risk or reduce risk. Buying insurance makes the most sense when the potential loss is great and there is a significant probability of loss.
Insurance company protects people and businesses against the risk of unforeseeable events. It is a risk transfer mechanism by which the losses of the few are paid for by the many, with the premiums based on the risk of each individual or entity How many people are knowledgeable about insurance policy and how many of them claim insurance? Lets say about four in 10 men describe themselves as being very knowledgeable about life insurance. As in the problem statement, about 2 or 3 get hospitalized out of 100, which means 2 to 3 percent claim the insurance. This way everyone shares the risk of everyone else.
So we need to building a model to predict whether a customer would be interested in Vehicle Insurance is extremely helpful for the company because it can then accordingly plan its communication strategy to reach out to those customers and optimise its business model and revenue. Now, we need to predict whether the customer would be interested in Vehicle insurance or not.
After loading our dataset, the first thing we did was look for duplicates and null values. There were no duplicates or null values, thus there was no need to treat them.
With the aid of exploratory data analysis:
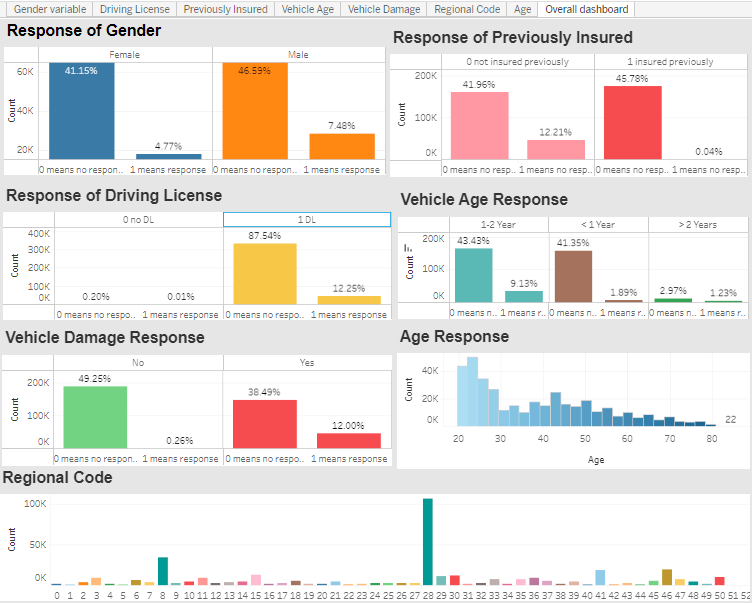
The gender variable in the dataset is spread nearly evenly. The male category is marginally larger than the female category, and the likelihood of purchasing insurance is also slightly higher. The response rate of those who are not interested in purchasing vehicle insurance is higher than that of those who are interested in buying vehicle insurance.Only 12.3% people are interested in buying vehicle insurance and 87.7% are not interested in buying vehicle insurance. So people who own the bike may already have vehicle insurance, or people might not be aware of insurance policy and pricing factors, which means the firm needs to come up with good marketing techniques and a pricing strategy to create awareness and offer an affordable price to the customers in order to reach out to more customers to generate more leads.
The response rate of those who are not interested in purchasing vehicle insurance is higher than that of those who are not interested in buying vehicle insurance. 99.8% of customers have DL, whereas 0.2% do not have DL. Only a small percentage of people who have a DL (12.2%) are interested in purchasing vehicle insurance. So almost all the people who own vehicles have DL because it's mandatory when you have a bike, and only a small percentage of people are interested in buying vehicle insurance. The possible reason might be that people who own the bike may already have vehicle insurance or insurance might be expired.
45.8% of people are insured previously, in that 12.2% of people interested to buy the vehicle insurance again, Which means people are aware of insurance policy and ready to pay a premium amount, for better off taking actions to avoid certain risks or reduce risk. So buying insurance makes the most sense when the potential loss is great and there is a significant probability of loss.
Around 4.2% of vehicles are more than two years old, 52.6% are between one and two years old, and 43.2% are under one year old. 1.2% are interested in purchasing vehicle insurance for vehicles older than 2 years, 9.1% are interested in purchasing insurance for vehicles between 1 and 2 years old, and 1.9% are interested in purchasing insurance for vehicles older than 1 year. As vehicle age increases most of the people are aware of insurance and interested to buy the insurance for reducing the risk.
50.5% of the vehicles have past damage.12.0% of people who have had a damaged vehicle in the past want to acquire vehicle insurance. So 50 percent of vehicles are damaged and 50 percent are not damaged, which means people with damaged vehicles (12%) are interested in buying insurance and are aware of vehicle insurance policies and its benefits, while the rest of the people might already have purchased insurance and do not need to purchase again.
Around 4.2% of vehicles are more than two years old, 52.6% are between one and two years old, and 43.2% are under one year old. 1.2% are interested in purchasing vehicle insurance for vehicles older than 2 years, 9.1% are interested in purchasing insurance for vehicles between 1 and 2 years old, and 1.9% are interested in purchasing insurance for vehicles older than 1 year. As vehicle age increases most of the people are aware of insurance and interested to buy the insurance for reducing the risk.
The dataset has more individuals with an age of 24. 40 to 60-year-olds had a higher likelihood of purchasing vehicle insurance. 9.3% of people in their middle age are interested in purchasing insurance. Almost 47% of middle-aged individuals have a driver's licence. About 21.9% of people in their teens have health insurance. Around 21.9% of persons in their teens have had insurance previously. So most teenagers have insurance and are aware of their policy. So the target audience might be middle-aged people and teenagers to generate more leads for insurance companies.
By using the inter quartile range, we eliminated outliers and dealt with null data. We split the dataset into train and test splits after feature encoding three columns. Further, we applied 6 machine learning algorithms to see which customers might be interested in purchasing vehicle insurance and we also used hyperparameter tuning for three models to discover which model gives the best results. Vehicle damage and annual premium are the two most significant features seen in decision trees, while vintage and annual premium are seen in random forests. With 93% and 92% ROC AUC scores, Decision Tree and Random Forest outperform all other models.