Usage
This document covers the usage of Hannibal, it does not cover its installation or configuration. If you did not do so already, please read the README first.
There are several reasons to disable automatic splitting, such as avoiding compaction storms, splitting at the correct key when your data growth is not uniform, or just having beautiful split-keys. But one problem that arises is that you have to monitor your region somehow.
HBase itself brings some kind of "service web UI" which exposes information about regions, their sizes and where they are deployed, but in a way that is not easily consumable by human brains. So the first question to ask is:
To answer this question, Hannibal's home page displays a graph with an overview of your RegionServers.

Each bar represents one RegionServer, as labeled in the x-axis. The bars are separated into different colours, where each colour represents one table, as indicated by the legend in the upper right corner. From there, you can also toggle the visibility of particular tables.
In this screenshot above, our regions are very unbalanced. As an example, let's pick the red article table: Only 32GB are served by the RegionServer c1-s3.cluster, while the Server c1-s5.cluster serves around 58GB, which is nearly a factor of two!
But how can that happen? The most obvious answer to this question might be that the number of regions differs heavily for each RegionServer - HBase prior to 0.94 actually has some issues with that. But that's not always the case, sometimes the sizes of particular regions vary heavily, so it might be interesting to ask ...
Clicking on a colored bar in the Home screen graph will take you to the table's detail view.
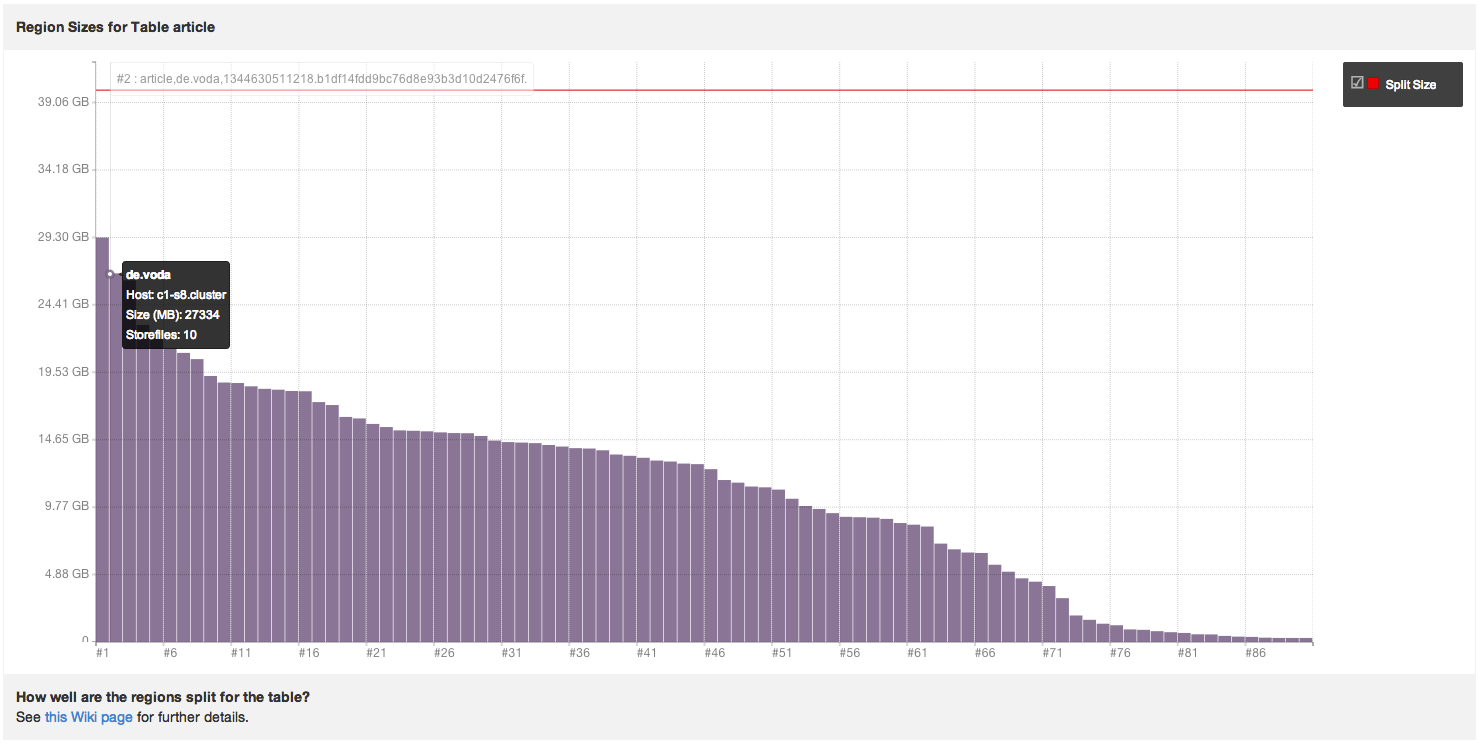
In this graph you get an overview of all regions for the table, ordered by their size. On an optimal table with evenly distributed regions, every bar should be about the same size. As you can see, in this example for the 'article' table, the regions vary in size from just a few MB up to 8GB.
What you should do next depends on what you want to achieve. While merging small regions into bigger regions should only be done when the cluster is down and is a very dangerous task, splitting bigger regions into smaller ones is actually pretty easy. Whether you do something or not, it may be worth to take a deeper look into one of the regions, especially your bigger ones. Because the bigger the region, the longer major compactions will last. When your major compactions last multiple hours, that might be a strong signal that the region should be split. But how can you find out how long the compactions take?
Besides compactions, you may also wonder about other aspects of a region's history, so the last question for Hannibal is
Clicking on a bar in the table graph described above will take you to the region's detail view.
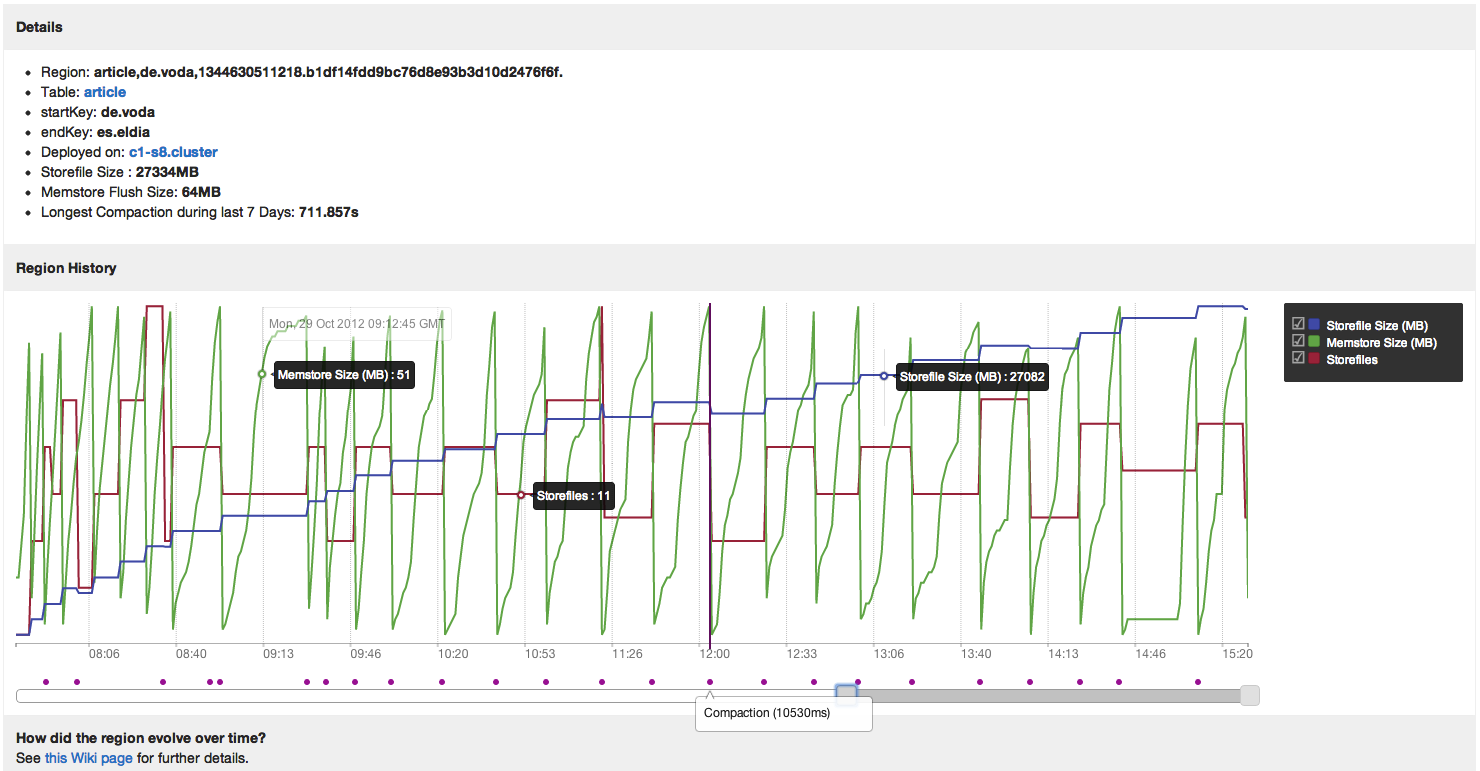
Besides some basic information about your region, you may notice the "Longest compaction during last 7 Days" information. Always keep an eye on that number for your bigger regions.
Right below the basic information you can find the history graph, which displays your region's metrics for the last 24 hours. You can zoom into the graph by using the sliders below it. This will reveal information about:
- The number of storefiles
- The size of your memstore
- The size of your storefiles
- The compactions
At the first look this might be a bit overwhelming, but you can move your mouse over the lines for tooltips with information for that metric. It might also help to deactivate some metrics in the legend.