-
Notifications
You must be signed in to change notification settings - Fork 48
Complexity trend analysis
As described in Hotspot Analysis, cyclomatic complexity, or even just code size (number of lines), are indicative enough metrics that, together with the learnings that come from data-mining the code history, may provide useful insights and could help detecting issues with the code quality.
Often the most interesting and useful part of analysing the quality of a piece of code is not the absolute numbers of the metric, but rather the ability to break down how complexity changes in time and to possibly identify potential growth patterns as well as the reasons behind it.
This tasks tracks how the number of source lines of code changes with each revision in the given period of time for a given file.
$ gulp sloc-trend-analysis --targetFile=<targetFile> [--dateFrom=<dateFrom>] [--dateTo=<dateTo>]- The targetFile parameter identifies the file under investigation. The path must be relative to the root of the repository and not an absolute path..
Note: the npm sloc module used to count lines of code only supports the parsing of a pre-defined list of file extensions. I made possible to extend such list with custom file extension mappings. See Advanced setup for details.
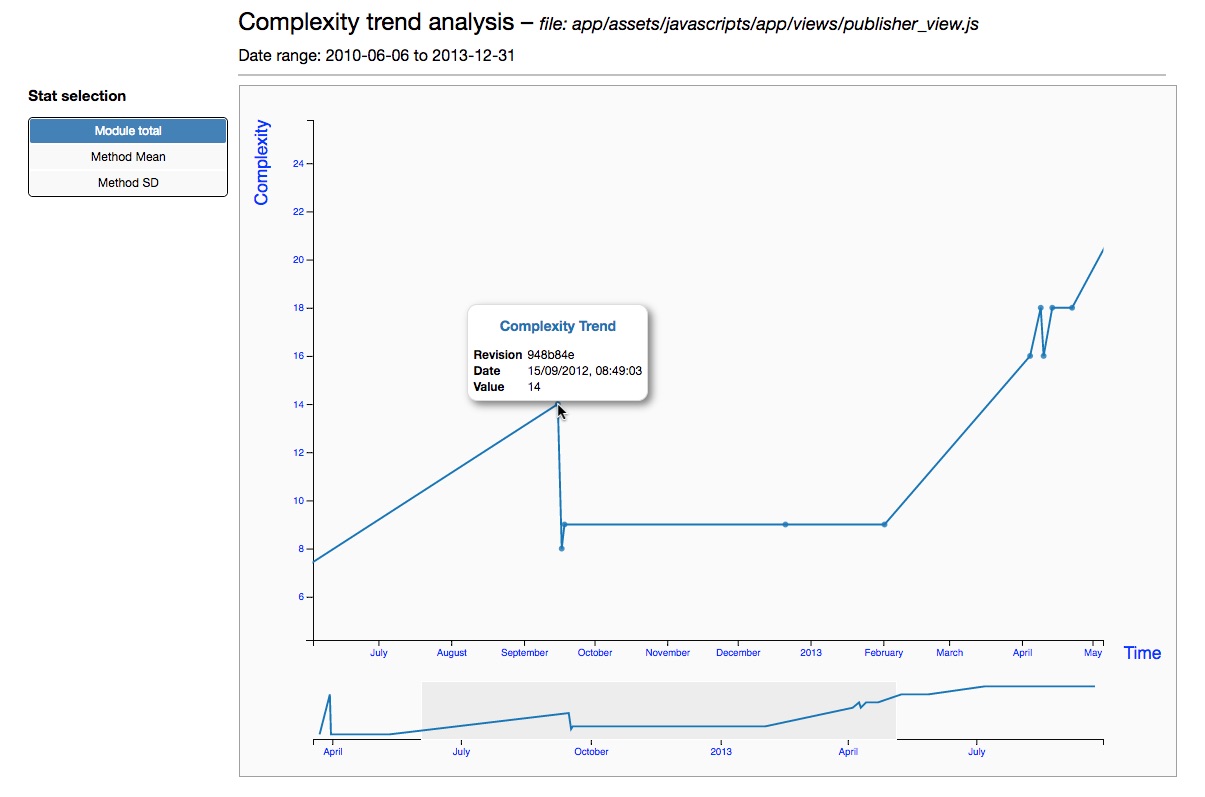
Metrics trend results are well displayed through simple line charts where the value of a metric is plotted against a time scale. The curve is interpolated over the range of the metric values, and each value point (dot in the diagram) corresponds the metric value at the point in time of each revision of the file.
These tasks track how the cyclomatic complexity changes with each revision in the given period of time.
$ gulp javascript-complexity-trend-analysis --targetFile=<targetFile> [--dateFrom=<dateFrom>] [--dateTo=<dateTo>]$ gulp ruby-complexity-trend-analysis --targetFile=<targetFile> [--dateFrom=<dateFrom>] [--dateTo=<dateTo>]- The targetFile parameter again identifies the file under investigation. The path must be relative to the root of the repository and not an absolute path..
For these analysis charts an additional zoom feature is available that allows us to stretch the timeline to display a finer level of detail and pin-point a particular revision and date when a particular step change happened:
When cyclomatic complexity data is available on a per method/function basis the complexity trend analysis shows two additional diagrams displaying the evolution in time of the statistical mean and standard deviation of the distribution of the complexity across the module/class methods/functions.

