-
Notifications
You must be signed in to change notification settings - Fork 11
SONATA Profiler: Overview
The basic idea of son-profile is to do some load testing under different resource constraints on network services deployed on SONATA’s emulation platform. During these tests a variety of metrics can be monitored which allows service developers to find bugs, investigate problems or detect bottlenecks in their services. The main purpose of son-profile is to automate big parts of this workflow to support network service developers as much as possible. The general idea of introducing a profiling functionality in the SONATA SDK is described in Deliverable 3.2.
son-profile supports to major usage modes:
- Active Mode: Create a series of service packages, each with a specific resource limitation and defined functional tests. These packages can be automatically deployed on the emulator or MANO platform where the functional tests are executed and metrics are gathered.
- Passive Mode: This mode assumes that a service is pre-deployed in the SONATA emulator. The defined functional tests are executed and metric are gathered and statistically analyzed. This has the advantage that resource limitations, test traffic generation and specialized monitoring can be installed by leveraging the REST API and other unique features of the SONATA emulator.
Both modes are further detailed in the next sections.
The active mode of son-profile allows the user to specify profiling experiments and a service package to which these experiments should be applied. Based on this, son-profile generates a couple of new service packages each of them representing exactly one resource configuration that should be tested during the profiling experiments. One of the main updates to the previous version of son-profile is its improved modularization as explained in the following.
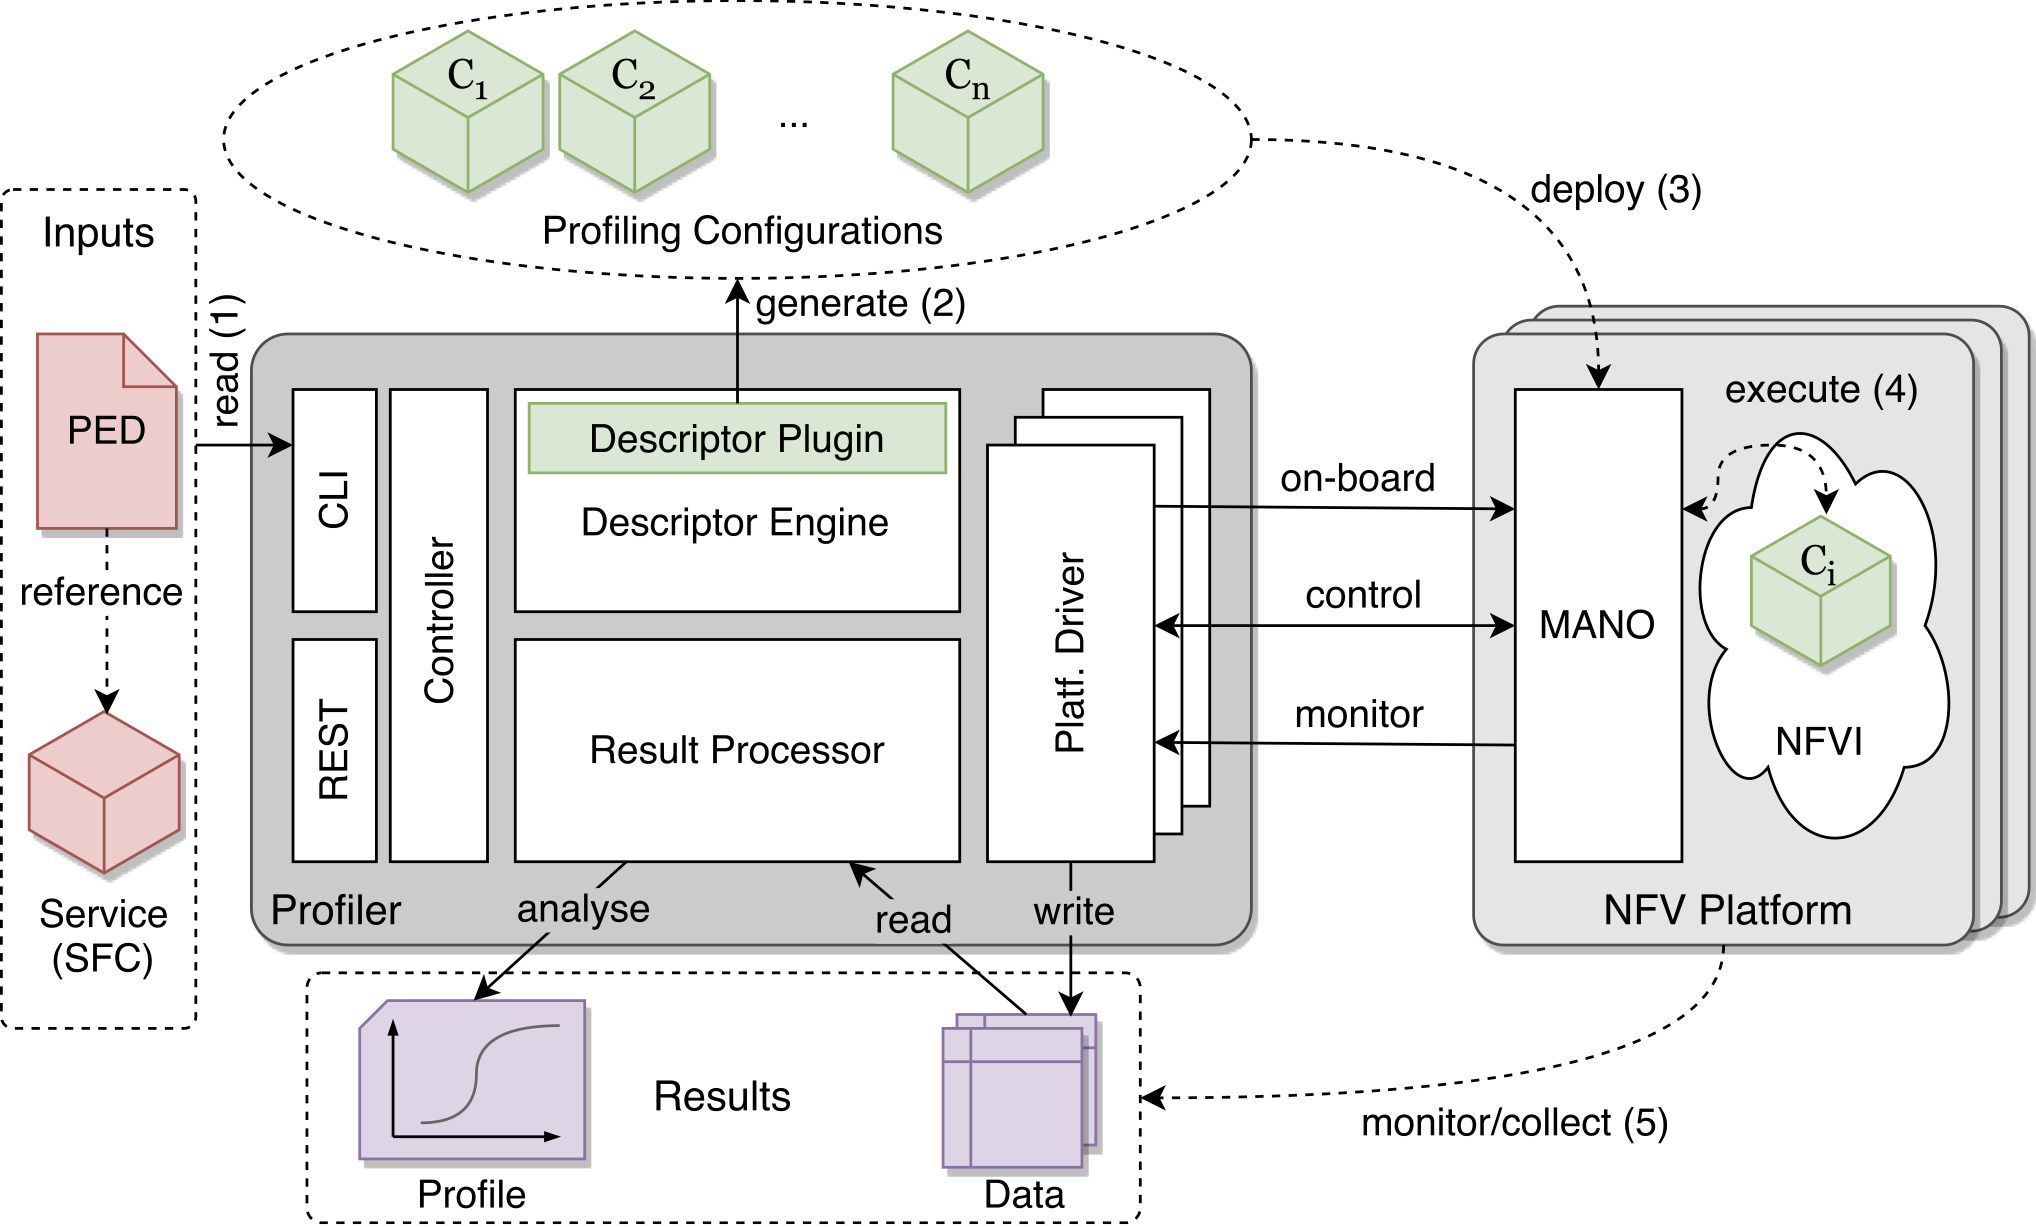
The following figure describes our system as well as the active profiling workflow. In the first step, a user creates a profiling experiment descriptor (PED) that contains all necessary information to perform a profiling experiment. In particular, it references the network service that should be profiled, e.g., a service package or service descriptor, and it includes descriptions of all service configurations that should be tested, e.g., different resource assignments for the used VNFs. The PED is used to trigger our profiling system by using its command line (CLI) interface (step 1). The profiler reads the PED and forwards the request to its descriptor engine. This module takes the network service referenced by the PED file and embeds (or extends) it with additional measurement VNFs, called measurement points (MP). Our system offers default measurement point VNFs that contain standard networking test tools, like iperf or hping. A user can replace these by any custom measurement VNF which may, for example, contain domain-specific, proprietary traffic generators. After the embedding step, one copy of the new service description, for each configuration specified in the PED, is generated (step 2). This includes resource configurations, like number of cores assigned to a VNF. The descriptor engine itself offers a plugin interface for service description generators so that our profiler becomes service descriptor agnostic and can be extended to third-party description formats.

In the third step, the previously generated service configurations are deployed one after the other on the target platform(s) using the platform driver modules (step 3). These drivers act as a client to the target platform (usually son-emu) and form an abstraction layer between specific MANO northbound interfaces and our internal control mechanisms.
Once a service instance is up and running, the traffic generators in the additionally deployed ''measurement point'' VNFs are activated and start to stimulate the service. After this, the service instance is destroyed and removed from the platform before the next service configuration is deployed. We call the deployment, execution, and test of a single service configuration a profiling round.
During a profiling round, performance data is collected in two ways (step 4). First, service-internal performance metrics are monitored, including log files inside the measurement points and VNFs (if enabled). Second, platform metrics, like packet counters on virtualized interfaces, are collected through the platform's monitoring APIs. The latter are platform-specific and may not be available on each target platform.
As a last step (step 5), all measured data, collected from various sources, is aggregated and stored in a unified, table-based format. Each row in this table represents exactly one of the tested service configurations. These tables are then passed to a post-processing module which automatically triggers user-defined analysis scripts that can, for example, perform statistical analysis on the collected datasets.
Based on the experiment descriptors and the service specification, our profiling system will generate one service configuration for each combination of parameters that should be tested. The generation of these configurations highly depends on the service descriptor technology used by the target platforms. This is why we use a plugin design to generate the descriptions which allows to implement specific generators for third-party description approaches.
One of the main functionalities of these generators is to extend the network service descriptor of the service under test with additional measurement VNFs. This can be achieved with two different approaches shown in the following figure.

The first approach extends the main service graph as such by appending the additional VNFs to the connection points specified in the PED (a). The second approach, in contrast, does not modify the network service descriptor as such but embeds it into another service descriptor that contains the measurement VNFs (b). As shown in the figure, the second approach has a much cleaner design and simplifies the generator implementation. However, it requires that the target platform supports hierarchical service structures.
The passive execution mode of son-profile is used to dynamically control and monitor a service which is pre-deployed in the SONATA emulator.
Resource allocation can be dynamically adjusted. Functional tests can be generated and the set of monitored metrics can be specified. During these tests, the monitored metrics will be statistically analyzed and a summary of the measured results will be generated, giving an indication of the VNF's performance and used resources.
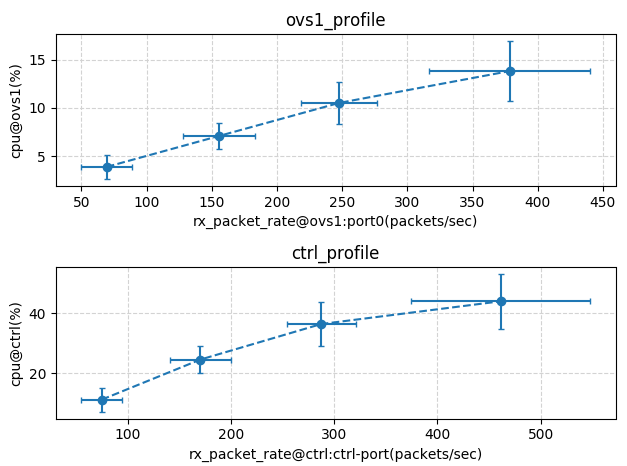
In the following figure we see the results of such a passive profile run.
Each measurement point indicates one functional test, where the VNF or service was loaded with a fixed traffic rate during a specified period.
On the X-axis the average input load is given, on the Y-axis the measured average CPU load. Error bars indicate the 95% confidence interval of the measurement point. We can see that the confidence interval increases as the host is experiencing more load. This is an important indication, as an overloaded host will not generate representative performance data of the VNF skewnessmonitor.

The basic usage the passive profiling mode is via following CLI command, starting a profiling run on a pre-deployed service with a specified PED file:
son-profile -p ped_ctrl.yml --mode passive
This is the complete list of options that are implemented for this command:
-
--mode passive: required to indicated passive mode. -
-p ped_file.yml: required, path to the PED file with the profile configuration. -
--no_display: optional, if specified no metrics are dynamically displayed during the test runs. (no use of the ncurses library to adapt the terminal window). -
--graph_only: optional, if specified no test runs are generated, only a graph is generated from an existing result file. -
--results_file -r: optional, path where the results are stored (default: test_results.yml in the working directory).