-
Notifications
You must be signed in to change notification settings - Fork 20
Java Logging on Google Cloud Platform
If you're trying to ship logs from Java to the logging service in GCP, this document is for you. I frequently mention Google App Engine but this article is relevant whether you're logging from App Engine, Cloud Run, Compute Engine, or even from outside GCP entirely.
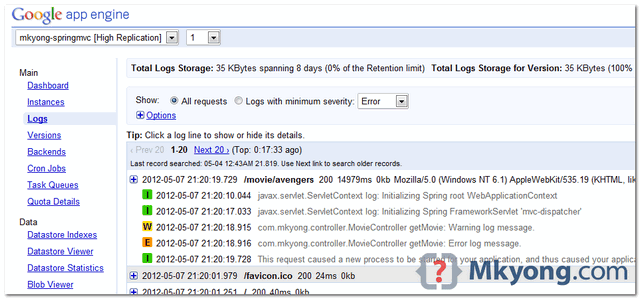
Long before there was Google Cloud Platform, there was Google App Engine. I became a fan in 2009, when they launched the Java runtime. Everything just worked - especially logging, which was downright miraculous:
- Log the way you normally do, through
slf4jorjava.util.logging. - Logs are presented as a list of requests
- Searches give you whole requests
- Requests can be expanded to show all the individual log messages in that request
- Requests themselves are marked INFO, WARN, ERROR, etc depending on the most severe single log in the request
Best of all, no special configuration was necessary. Just the standard logging.properties.

The only screenshot I could find of the pre-stackdriver logs UI, taken from here
In 2012, Google made the Java7 runtime available. Everything continued to work as expected.
In 2016, Google replaced the logging UI (and presumably the backend) with "Stackdriver Logging". Other than learning a new UI, everything continued to work as expected.
In 2017, Google made the Java8 runtime available. Everything continued to work as expected.
In 2019, Google made the Java11 runtime available. Everything did NOT continue to work as expected. Logs were a flurry of unorganized text lines, just like the quaint old days of /var/log/.
I am only a little embarrassed to admit that until very recently, December 2023 Anno Domini, I kept my company's major apps on Java8. New features of Java, nice as they are, just aren't as compelling as "usable logs". Without any straightforward documentation on how to fix them... we decided to wait until Google shuts down the Java8 runtime. End of January.
This document is what I learned in the ~week it took to upgrade. Maybe it will save you some time.
Google App Engine isn't special anymore. Instead of a special backchannel which automatically adds metadata (so your logs aren't just lines of text), GAE apps on the Java11+ runtime submit logs the same way as any other application inside or outside GCP.
So how do you ship logs with vanilla GCP?
As a practical matter, logs are delivered to the Cloud Logging service using gRPC. Google provides a client library that gives you low-level access to this service:
try (Logging logging = LoggingOptions.getDefaultInstance().getService()) {
    LogEntry entry =
        LogEntry.newBuilder(StringPayload.of(textPayload))
            .setSeverity(Severity.ERROR)
            .setLogName(logName)
            .setResource(MonitoredResource.newBuilder("global").build())
            .build();

    logging.write(Collections.singleton(entry));
}
You obviously don't want to litter your code with this, so you'll probably use a higher-level abstraction. But this API can be handy for shipping arbitrary data into a custom log, giving you a nice search interface.
You've probably built your application using slf4j or java.util.logging. Good news, you can route this to Google Cloud Logging! But there's some setup work.
There are multiple few ways to hook this up together, but this is the most straightforward:
- Use logback, if you aren't already
- Route all other logging systems to slf4j/logback
- Install the Google Cloud Logging appender for logback
- Configure logback to route logs to console or Cloud Logging depending on the environment
Logback is the "native" implementation of the slf4j logging facade. I will assume you're mostly familiar with it; by including the logback-classic jar in your project, logs sent to slf4j (by either your code or your dependencies) will be processed by logback.
Your code (or your dependencies) might use other logging systems besides slf4j. You can (and should) route them into slf4j (and thus logback) using bridge jars:
-
jul-to-slf4jroutesjava.util.logginginto slf4j -
jcl-over-slf4jroutes apache commons logging into slf4j (be sure to exclude thecommons-loggingjar from your build) -
log4j-to-slf4jroutes log4j into slf4j (be sure to exclude thelog4jjar from your build)
By including these bridge jars into your project, logs from those systems will be sent through the slf4j facade and into logback.
Google provides a custom appender for logback that will send log messages to Google Cloud Logging. Include it in your build:
<dependency>
    <groupId>com.google.cloud</groupId>
    <artifactId>google-cloud-logging-logback</artifactId>
    <!-- import google's libraries-bom so you don't have to worry about the version here -->
</dependency>Now you need to configure logback to route your logs appropriately. However, there's a trick:
- In production, staging, or other server-side environments, you want to route logs to Cloud Logging
- In local development, CI, and testing, you want to route logs to console (NOT to Cloud Logging)
Logback has several ways to change the configuration in different environments, but my favorite is this: Logback checks for configuration files on the classpath; first it looks for logback-test.xml; if it can't find that, it looks for logback.xml.
Put your server-side logback configuration in logback.xml; put your development/test configuration in logback-test.xml. In your server-side build/deploy script, exclude or delete logback-test.xml.
This is a normal logback configuration file, nothing google-specific. It logs to the console and does not interact with Google Cloud Logging. Perfect for local development and your CI system.
<configuration>
    <appender name="STDOUT" class="ch.qos.logback.core.ConsoleAppender">
        <encoder>
            <pattern>%d{HH:mm:ss.SSS} [%thread] %-5level %logger{36} - %msg%n</pattern>
        </encoder>
    </appender>

    <root level="info">
        <appender-ref ref="STDOUT" />
    </root>

    <logger name="com.example" level="debug"/>
    <logger name="com.example.other" level="info"/>
</configuration>
The server-side logback configuration sends logs to Google's custom appender and NOT to console. Use this in your production and staging environments.
<configuration>
    <appender name="CLOUD" class="com.google.cloud.logging.logback.LoggingAppender">
        <log>application_log</log>
        <resourceType>gae_app</resourceType>
        <flushLevel>warn</flushLevel>

        <!-- I will discuss this later, under "Correlating Logs" -->
        <enhancer>com.google.cloud.logging.TraceLoggingEnhancer</enhancer>
    </appender>

    <root level="info">
        <appender-ref ref="CLOUD" />
    </root>

    <logger name="com.example" level="debug"/>
    <logger name="com.example.foo" level="info"/>
</configuration>Now is a good time to test this in your staging environment. In the logs explorer, examine the structure of one log entry.
If you see a textPayload field, it means you did something wrong and logs are still being sent to console instead of through the custom appender:
textPayload: "Your log message"
If you see a jsonPayload field, it worked!
jsonPayload: {
    message: "Your log message"
}

Congratulations, you're halfway done. Unfortunately, you will quickly notice that your logs are a jumbled mess. There's no grouping of logs by request. For that you need...
Google's mechanism for grouping log messages comes from a different service, Cloud Trace, which is why official documentation is hard to find.
Log messages are grouped by a trace ID that you can submit with log messages. Remember this part of the logback config?
    <appender name="CLOUD" class="com.google.cloud.logging.logback.LoggingAppender">
        [...]
        <enhancer>com.google.cloud.logging.TraceLoggingEnhancer</enhancer>
    </appender>
That enhancer holds "the current ID" in a thread local and attaches it to any log messages it sends to Cloud Logging. Where does it get the ID? You must set it explicitly.
Where do you get the ID? Well, there are two possible cases:
- If you're running in Google infrastructure, behind a Google load balancer (eg App Engine, Cloud Run, etc) then you get the ID from an HTTP header
X-Cloud-Trace-Context. This ID is associated with the request, so your log messages will be correlated with the correct entry in therequest_log. - If Google hasn't established an ID for you, make up your own.
Here's an http servlet filter you can install in your application that will identify or establish the trace ID and provide it to the TraceLoggingEnhancer:
package com.example;

import com.google.appengine.api.utils.SystemProperty;
import com.google.cloud.logging.TraceLoggingEnhancer;
import com.orbitkit.houston.util.http.Http;

import javax.servlet.Filter;
import javax.servlet.FilterChain;
import javax.servlet.FilterConfig;
import javax.servlet.ServletException;
import javax.servlet.ServletRequest;
import javax.servlet.ServletResponse;
import javax.servlet.http.HttpServletRequest;
import javax.servlet.http.HttpServletResponse;
import java.io.IOException;

public class CorrelatedLogFilter extends Filter {
	/** This is discovery on GAE; other systems will be different - or you can hardcode */
    private static final String PROJECT_ID = SystemProperty.applicationId.get();

    private void doFilter(final HttpServletRequest request, final HttpServletResponse response, final FilterChain chain) throws IOException, ServletException {
        try {
            final String traceId = traceIdOf(request);
            final String formatted = String.format("projects/%s/traces/%s", PROJECT_ID, traceId);

            TraceLoggingEnhancer.setCurrentTraceId(formatted);

            chain.doFilter(request, response);
        } finally {
            TraceLoggingEnhancer.setCurrentTraceId(null);
        }
    }

    private String traceIdOf(final HttpServletRequest request) {
        final String traceHeader = request.getHeader("X-Cloud-Trace-Context");
        if (traceHeader != null) {
            return traceHeader.split("/")[0];
        } else {
            return UUID.randomUUID().toString();
        }
    }

    @Override
    public void doFilter(final ServletRequest request, final ServletResponse response, final FilterChain chain) throws IOException, ServletException {
        this.doFilter((HttpServletRequest)request, (HttpServletResponse)response, chain);
    }

    @Override
    public void init(final FilterConfig filterConfig) throws ServletException {}

    @Override
    public void destroy() {}
}
Put this filter as early as possible in the chain! Ideally first. Any log messages sent before the TraceLoggingEnhancer.setCurrentTraceId() will not be associated with the request and will seem "lost".
Note that the X-Cloud-Trace-Context header format differs from what you provide to the TraceLoggingEnhancer and must be parsed.
Hooray, your logs are now sane again! But there are still some quirks and surprises if you're coming from the GAE Java8 runtime.
Even though log entries are now grouped by request, the Logs Explorer doesn't show them to you that way by default. You still see a jumble of unrelated log entries, but you can "Show matching entries" to filter to the entries for that request.
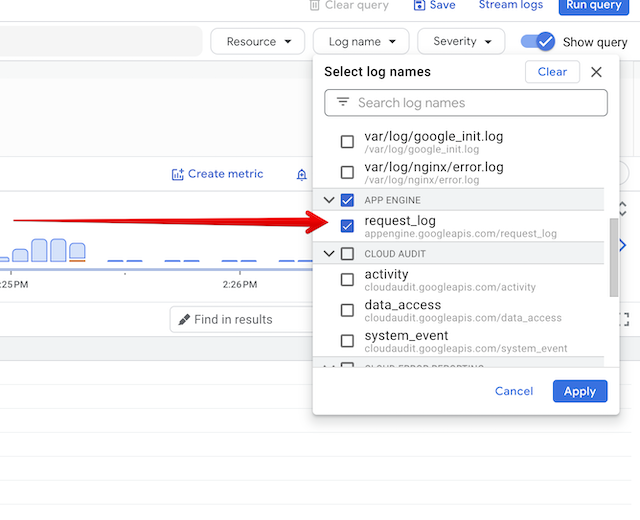
If you're on Google App Engine and you want to bring back the experience of the old request-centric GAE log explorer, there is an answer: Filter to the request_log:

This gives you a list of requests - and you can expand each request to see the log entries from that request. This is especially convenient while tracing the chronological activity of clients.
In the old experience, requests would be marked with colored debug/info/warn/error icons based on the most severe log message in the request. This is no longer the case, so the request log at-a-glace now looks like a bland wall of text. It's much harder to notice issues.
One thing you might want to be aware of if you're performing custom searches: Your logs now have three different kinds of payloads:
-
request_logentries haveprotoPayload - Your
application_logentries havejsonPayload - Jetty-issued log entries have
textPayload
Exceptions thrown out of your code (say, a servlet that throws an exception) and caught by Jetty will fall into that last category. You don't usually have to be too concerned about the structure of log messages when searching for text strings, but sometimes you're searching for terms (particularly numbers) that commonly appear as noise in other fields. If you're wondering why your filter on jsonPayload isn't giving you the expected results, it may be because what you're looking for is actually in a textPayload.
I hope I saved you some time. If you have any suggestions or comments, please put them on Hacker News.
