Skip to content

echarts折线图颜色分段,渐变填充色,标签过长省略号

Notifications You must be signed in to change notification settings

territoryfan/echarts

Folders and files

NameName
Last commit message
Last commit date

Latest commit


History

6 Commits


Repository files navigation

echarts折线图不同颜色段,渐变填充色,添加虚线等效果

点的顶端显示内容在series里添加itemStyle。

折线图根据数据实现不同颜色,需要把数据进行拼接,后面的数据值正好跟前面数据的末尾接上,前面的空出,并在series数组形式分别展示不同颜色段。

在折线图下面添加渐变填充色,使用echarts.graphic.LinearGradient。

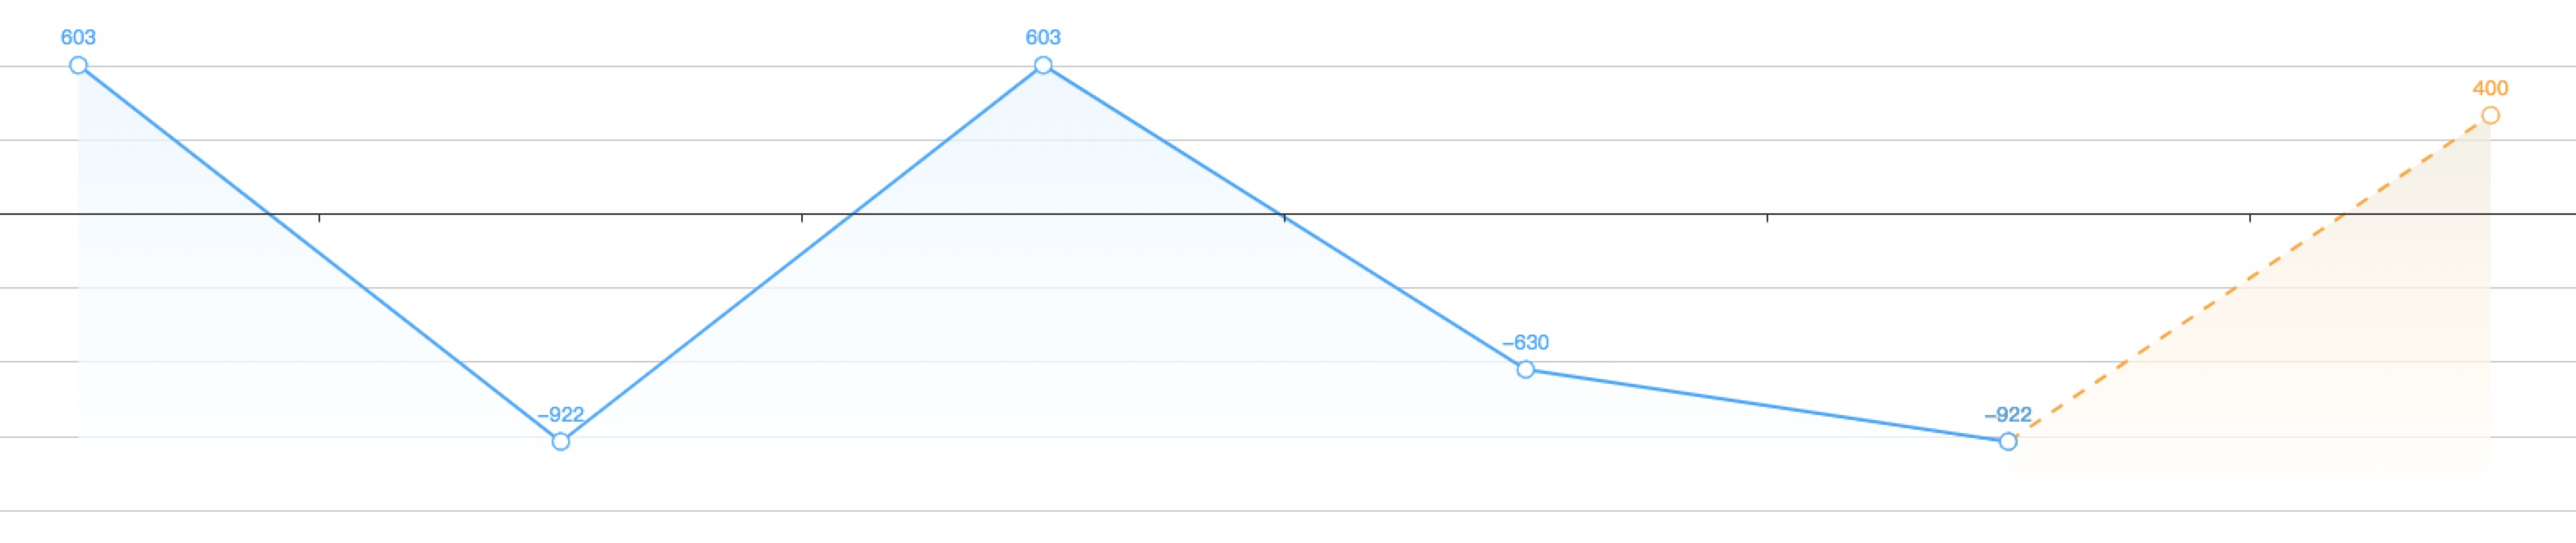
var data1 = [603, -922, 603, -630, -922];
var data2 = ['', '', '', '',-922, 400];
var dataX = ['01','01', '02', '01','01', '02'];
series: [
      {
          data: data1,
          type: 'line',
          z: 999999,
          smooth: false,
          symbol: 'emptyCircle',
          symbolSize: 10,
          showSymbol: true,
          itemStyle : { 
            normal: {
              label : {
                show: true // 顶端内容显示
              },
              color: "#25a4fb",
              lineStyle: {
                color: "#25a4fb"
              }
            }
          },
          areaStyle: {
            normal: {      
              origin: 'start',
              color: new echarts.graphic.LinearGradient(     
                  0, 0, 0, 1,
                  [
                    {
                      offset: 0, 
                      color: '#e6f5fe'
                    },
                    {
                      offset: 0.5, 
                      color: '#f5fbff'
                    },
                    {
                      offset: 1, 
                      color: '#fff'
                    }   
                  ]                  
              )                            
            }
          }
      },
      {
        name: '',
        type: 'line',
        smooth: true,
        symbol: 'emptyCircle',
        symbolSize: 10, // 圆点大小
        itemStyle:{
            normal:{
              label : {
                show: true // 顶端内容显示
              },
              color: "#ffa422",
              lineStyle:{
                  width:2,
                  color: '#ffa422',
                  type:'dashed' 
              }
            }
        },
        data: data2,
        areaStyle: {
          normal: {      
            origin: 'start',
            color: new echarts.graphic.LinearGradient(     
                0, 0, 0, 1,
                [
                  {
                    offset: 0, 
                    color: '#eee9da'
                  },
                  {
                    offset: 0.5,
                    color: '#fff6e8'
                  },
                  {
                    offset: 1, 
                    color: '#fff'
                  }
                ]                  
            )                            
          }
        }
      },
    ],

效果如图

Image text

坐标轴文本内容太长显示省略号,鼠标移入并显示全部

坐标轴省略号显示

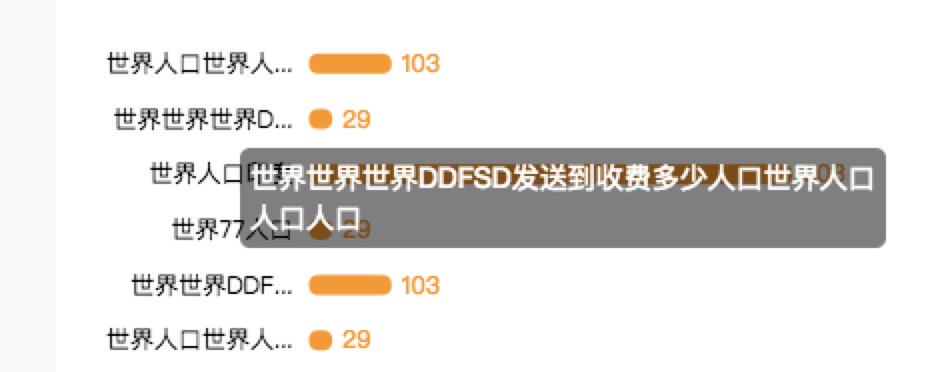
formatter: function (params, index) {
    // 超出省略
    params = params.toString();
    var maxlength= 8;
    if (params.length>maxlength) {
        return params.substring(0, maxlength-1)+'...';
    } else{
        return params;
    }
}

鼠标移入移出显示完整

//
<div id="main" style="min-height:400px;"></div>
<div id="tip" class="tipname hideTip"></div>
// 
.hideTip{ 
    display: none;
}
.tipname {
    position: absolute;
    background: rgba(0,0,0,0.5);
    border-radius: 5px;
    max-width: 400px;
    padding: 5px;
    z-index: 1;
    color: #fff;
}
//
myChart.on('mouseover', function (params) { 
    console.log(params);
    if( params.componentType == 'yAxis' ){
        var tt = $('#tip');
        tt.html(params.value);
        console.log('x='+params.event.event.layerX+'  ---'+'y='+params.event.event.layerY)
        tt.css('left', params.event.event.layerX+10);
        tt.css('top', params.event.event.layerY+20);
        console.log(tt.css('left'));
        tt.show();
    }
});
myChart.on('mouseout', function (params) {
    $('#tip').hide();
});

如图

Image text

每个点的顶部到x轴添加虚线

在series里添加

{
    type: 'pictorialBar', 
    data: data, // 放数据
    barGap:"10%",
    symbolRepeat:true,
    symbolMargin:2,
    symbol:"rect",
    symbolSize:1,
    color: '#ddd',
    symbolClip:true 
}

效果如图

Image text

About

echarts折线图颜色分段,渐变填充色,标签过长省略号

Resources

Stars

Watchers

Forks

Releases

No releases published

Packages

No packages published