The JSON Datasource executes JSON requests against arbitrary backends.
JSON Datasource is built on top of the Simple JSON Datasource. It has refactored code, additional features and active development.
To install this plugin using the grafana-cli tool:
grafana-cli plugins install simpod-json-datasourceSee here for more information.
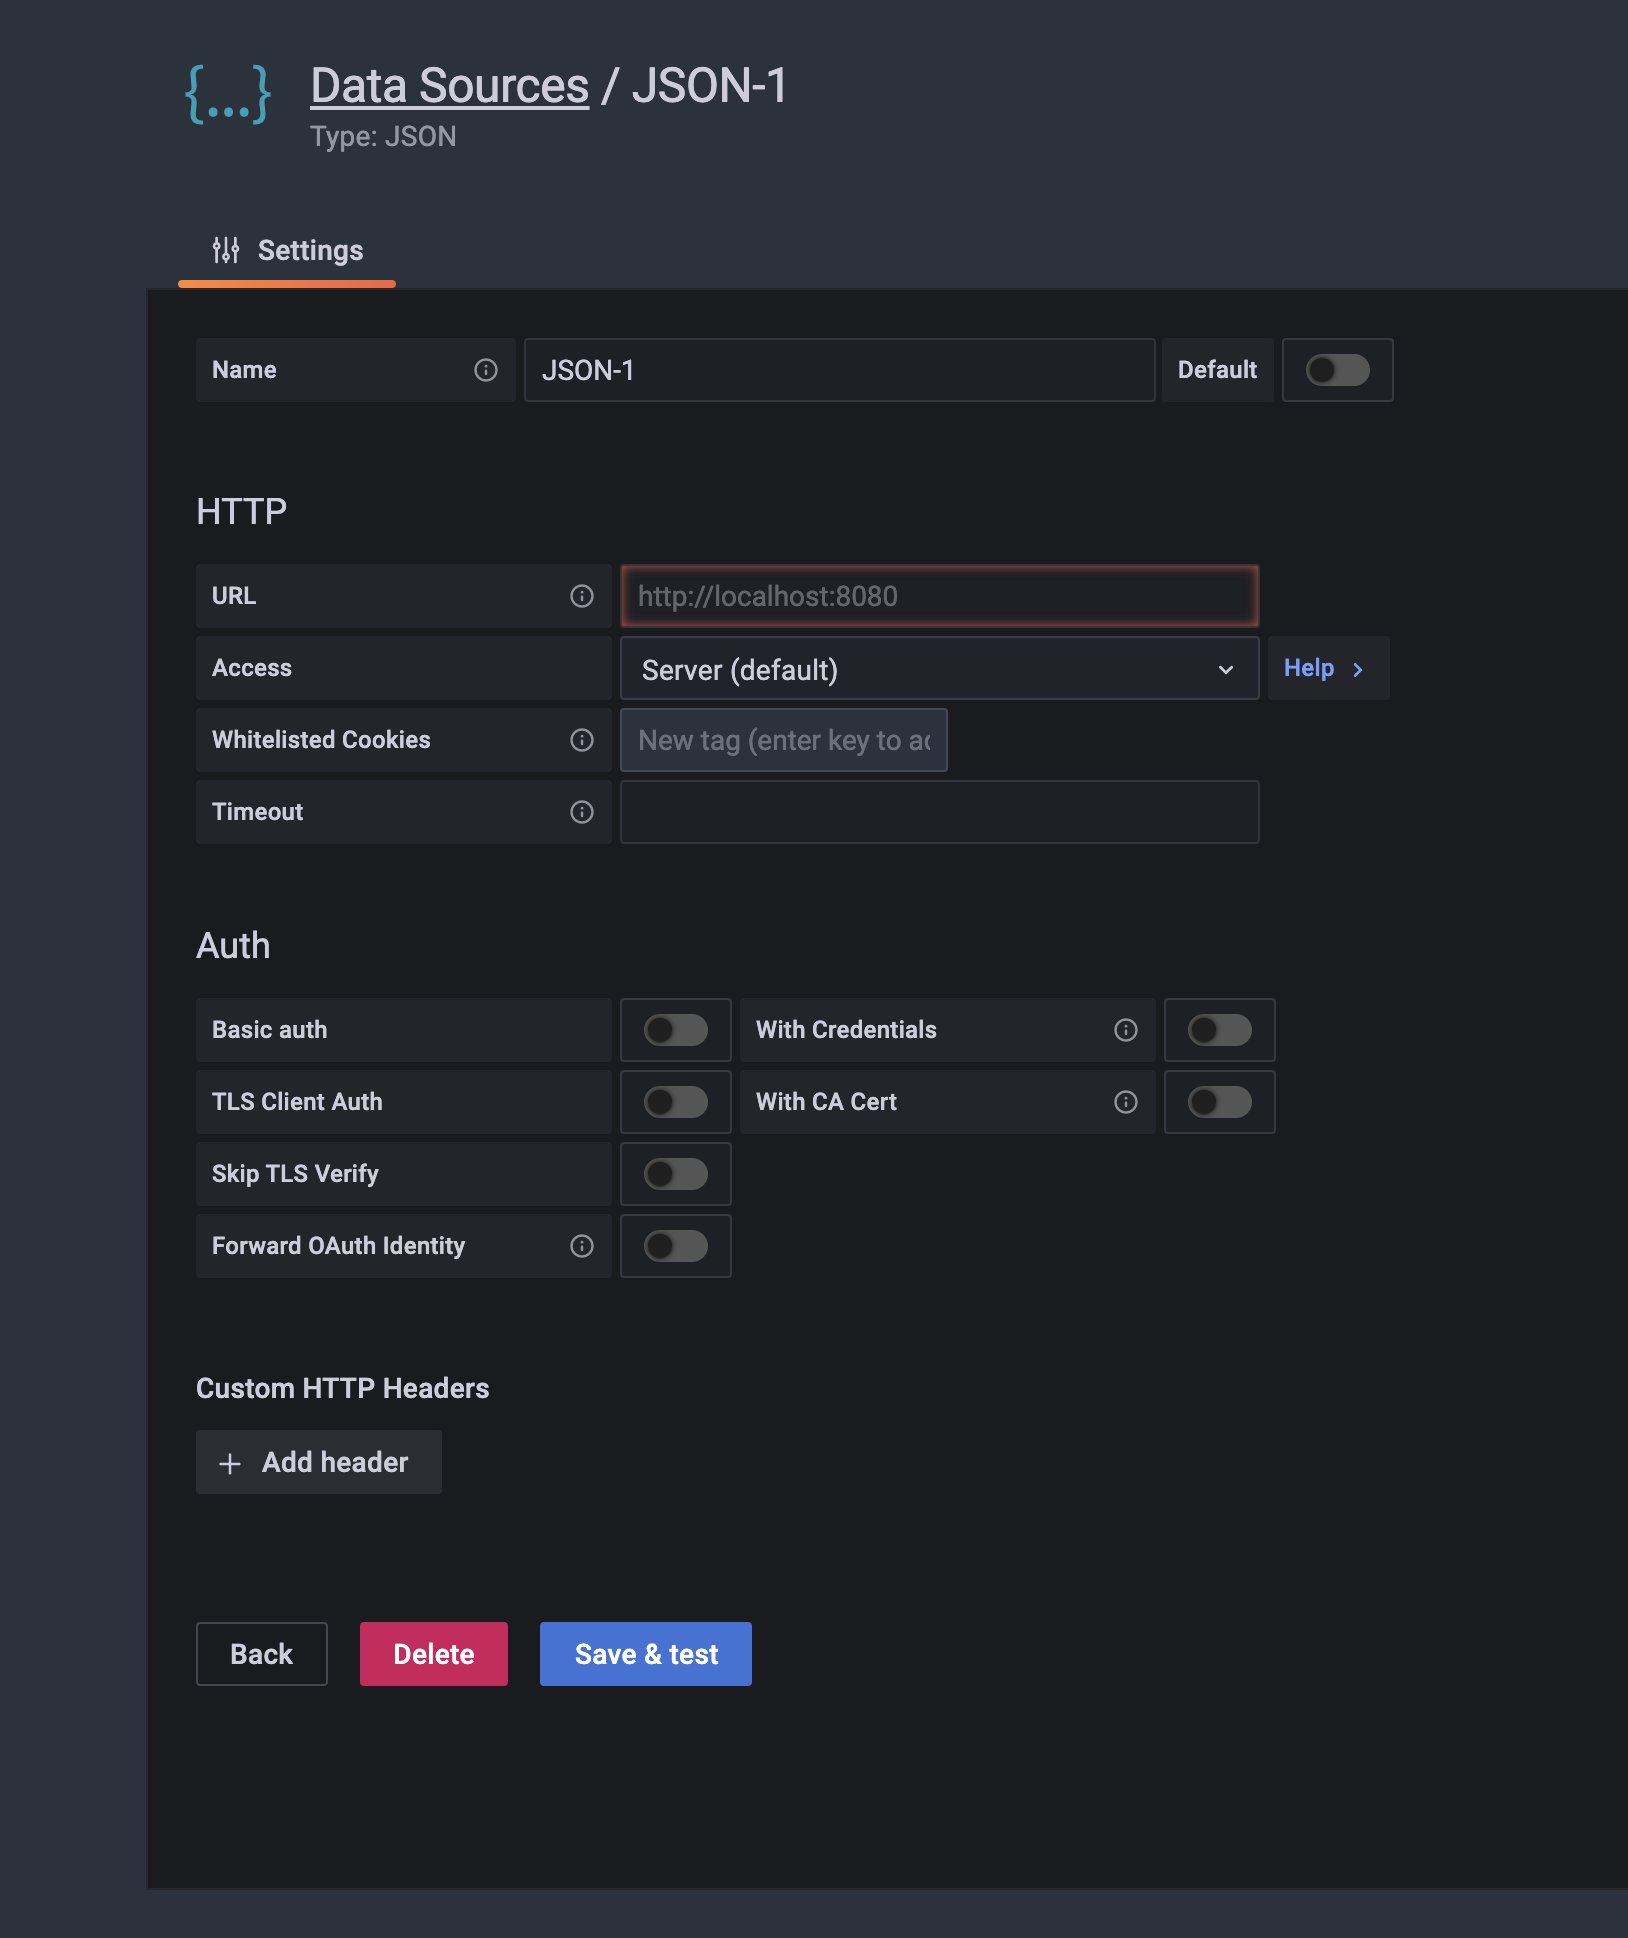
When adding datasource add your API endpoint to the URL field. That's where datasource will make requests to.
To work with this datasource the backend needs to implement 4 urls:
/should return 200 ok. Used for "Test connection" on the datasource config page./searchshould return available metrics when invoked by the find metric options on the query tab in panels./queryshould return metrics based on input./annotationsshould return annotations.
Those two urls are optional:
/tag-keysshould return tag keys for ad hoc filters./tag-valuesshould return tag values for ad hoc filters.
Example request
{ "type": "timeseries", "target": "upper_50" }The search api can either return an array or map.
Example array response
["upper_25","upper_50","upper_75","upper_90","upper_95"]Example map response
[ { "text": "upper_25", "value": 1}, { "text": "upper_75", "value": 2} ]Example timeseries request
{
  "panelId": 1,
  "range": {
    "from": "2016-10-31T06:33:44.866Z",
    "to": "2016-10-31T12:33:44.866Z",
    "raw": {
      "from": "now-6h",
      "to": "now"
    }
  },
  "rangeRaw": {
    "from": "now-6h",
    "to": "now"
  },
  "interval": "30s",
  "intervalMs": 30000,
  "maxDataPoints": 550,
  "targets": [
     { "target": "Packets", "refId": "A", "type": "timeseries", "data": { "additional": "optional json" } },
     { "target": "Errors", "refId": "B", "type": "timeseries" }
  ],
  "adhocFilters": [{
    "key": "City",
    "operator": "=",
    "value": "Berlin"
  }]
}
Example timeseries response
[
  {
    "target":"pps in",
    "datapoints":[
      [622,1450754160000],  // Metric value as a float , unixtimestamp in milliseconds
      [365,1450754220000]
    ]
  },
  {
    "target":"pps out",
    "datapoints":[
      [861,1450754160000],
      [767,1450754220000]
    ]
  }
  {
    "target":"errors out",
    "datapoints":[
      [861,1450754160000],
      [767,1450754220000]
    ]
  }
  {
    "target":"errors in",
    "datapoints":[
      [861,1450754160000],
      [767,1450754220000]
    ]
  }
]
The relation between target in request and response is 1:n. You can return multiple targets in response for one requested target.
Example table response to be returned if the metric selected is "type": "table":
{
  "columns":[
    {"text":"Time","type":"time"},
    {"text":"Country","type":"string"},
    {"text":"Number","type":"number"}
  ],
  "rows":[
    [1234567,"SE",123],
    [1234567,"DE",231],
    [1234567,"US",321]
  ],
  "type":"table"
}
Sending additional data for each metric is supported via the Additional JSON Data input field that allows you to enter JSON.
For example when { "additional": "optional json" } is entered into Additional JSON Data input, it is attached to the target data under "data" key:
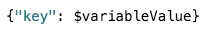
{ "target": "upper_50", "refId": "A", "type": "timeseries", "data": { "additional": "optional json" } }You can also enter variables:
The annotation request from the Simple JSON Datasource is a POST request to
the /annotations endpoint in your datasource. The JSON request body looks like this:
{
  "range": {
    "from": "2016-04-15T13:44:39.070Z",
    "to": "2016-04-15T14:44:39.070Z"
  },
  "rangeRaw": {
    "from": "now-1h",
    "to": "now"
  },
  "annotation": {
    "name": "deploy",
    "datasource": "JSON Datasource",
    "iconColor": "rgba(255, 96, 96, 1)",
    "enable": true,
    "query": "#deploy",
  },
   "variables": []
}
Grafana expects a response containing an array of annotation objects in the following format:
[
  {
    "text": "text shown in body" // Text for the annotation. (required)
    "title": "Annotation Title", // The title for the annotation tooltip. (optional)
    "isRegion": true, // Whether is region. (optional) (http://docs.grafana.org/reference/annotations/#adding-regions-events)
    "time": "timestamp", // Time since UNIX Epoch in milliseconds. (required)
    "timeEnd": "timestamp", // Time since UNIX Epoch in milliseconds (required if `isRegion` is true )
    "tags": ["tag1"], // Tags for the annotation. (optional)
  }
]
Note: If the datasource is configured to connect directly to the backend, you
also need to implement an OPTIONS endpoint at /annotations that responds
with the correct CORS headers:
Access-Control-Allow-Headers:accept, content-type
Access-Control-Allow-Methods:POST
Access-Control-Allow-Origin:*
Example request
{ }The tag keys api returns:
[
    {"type":"string","text":"City"},
    {"type":"string","text":"Country"}
]Example request
{"key": "City"}The tag values api returns:
[
    {"text": "Eins!"},
    {"text": "Zwei"},
    {"text": "Drei!"}
]This plugin requires node 6.10.0. Use of Yarn is encouraged to build.
yarn install
yarn run build