Image Model Analysis System v1.0
Python Version 3.6+
1)基本属性: 准确率,召回率 PR曲线 AP
2)支持分 类别, 难度
3)自定义融合类型: 将多个类别融合成为一个类别进行分析
4)配置文件: 配置文件yaml,设置标签,检测路径,各个类别的阈值,合并类别等
4)输出: 评估结果以csv输出,并按照难度分开输出,输出每个类别的pr曲线
- Label格式
Car 0.00 0 1.85 387.63 181.54 423.81 203.12 1.67 1.87 3.69 -16.53 2.39 58.49 1.57
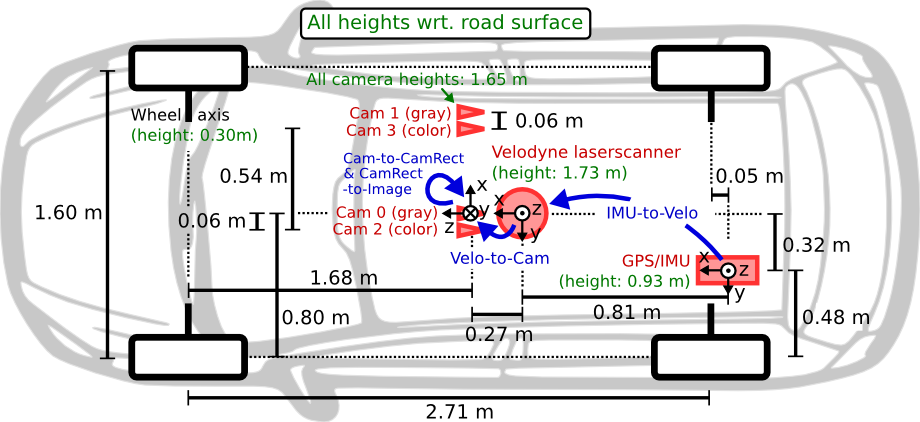
type truncated occluded alpha xmin ymin xmax ymax height width length location_x location_y location_z ry
type : 9类,‘Car’, ‘Van’, ‘Truck’,’Pedestrian’, ‘Person_sitting’, ‘Cyclist’,’Tram’, ‘Misc’ or ‘DontCare’
truncated : 截断率float, 0~1
occluded : 遮挡程度,0:无遮挡,1:小部门遮挡,2:大部分遮挡,3:完全遮挡
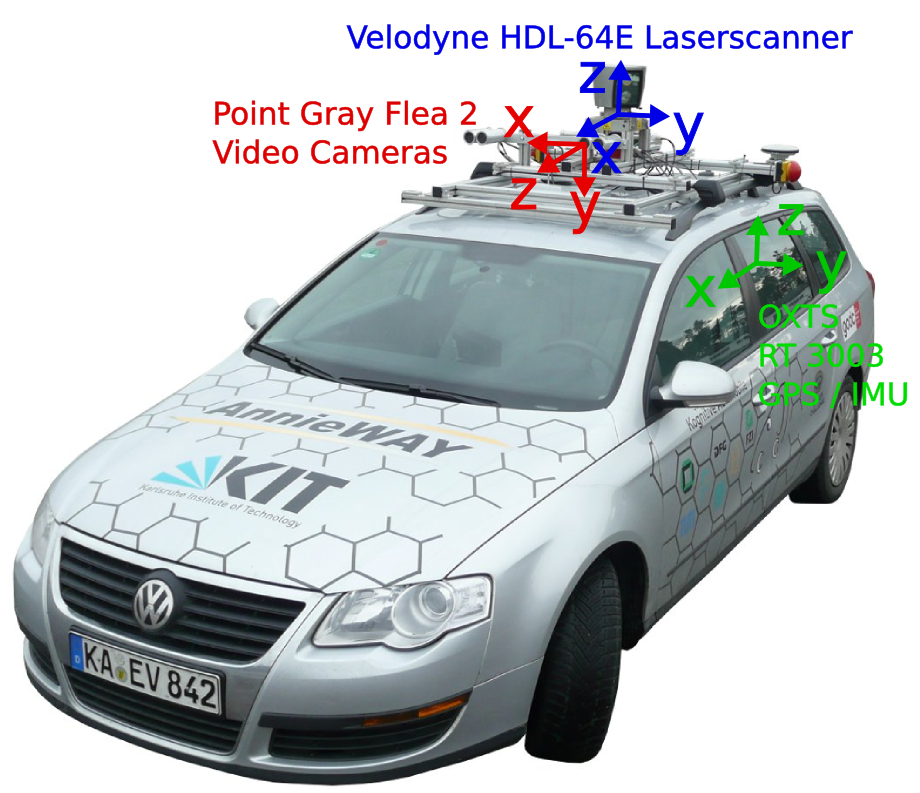
alpha : 物体观察角度(-pi~pi), 相机坐标系
xmin,ymin,xmax,ymax : 图像二维边框的坐标
height,width,length : 高,宽,长
location_x,location_y,location_z : 相机坐标系下距离x,y,z
ry : 相机坐标系下,物体全局方向角(物体前进方向与相机坐标系x轴的夹角) ,-pi~pi
- Detect Result格式
Cyclist 0.00 3 -1.65 676.60 163.95 688.98 193.93 1.86 0.60 2.02 4.59 1.32 45.84 -1.55
type truncated occluded alpha xmin ymin xmax ymax height width length location_x location_y location_z ry score
3)数据分布格式
4)结果导出格式
Install numpy pathlib matplotlib
Step 2: Configuration(configs/config.yml)
1)设置分析系统路径config_path到评估代码根目录
config_path: '/home/your_path/model_analyze_system/configs/config.yml'
2)设置类别评估
##True: eval every class
CLASS_EVAL: True
CLASS_NAME: ['Car','Pedestrian','Cyclist','Van','Truck','Person_sitting','Tram', 'Misc','DontCare'] # All possible class names
CURRENT_CLASS: ['Car','Pedestrian','Cyclist']
MERGE_CLASS:
  smallcar: ['Car']
  bigcar: ['Van','Truck','Tram']
  nocar: ['Pedestrian','Person_sitting','Cyclist']
  allcls: ['Car','Van','Truck','Tram', 'Pedestrian','Person_sitting','Cyclist']
MIN_IOU_THRESH: [0.7,0.5,0.5,0.7,0.7,0.5,0.5,0.5,0.5]
MARKER_THRESH: [0.0,0.0,0.0,0.0,0.0,0.0,0.0]

#CLASS_EVAL: True 打开分类别评估
#CLASS_NAME:groundtruth中可能出现的所有类别名称,避免键不存在错误
#CURRENT_CLASS:待分析的基本类别写入,分析系统会默认分析列出的类别
#将想要融合的类别设置于MERGE_CLASS下。融合类别中的子类别必须是CURRENT_CLASS中的类别。
#如果不需要融合类别则删除或注释掉所有的融合类别行。
#MIN_IOU_THRESH为判断每个类别是否被检测到的iou阈值,分别对应CURRENT_CLASS中的类别。
#MARKER_THRESH为评估报告中判断某个类别是否被检测到的score阈值,分别对应CURRENT_CLASS和	MERGE_CLASS中的类别。
3)设置难度评估
##True: eval every difficulty
DIFFICULTY_EVAL: True
DIFFICULTY: [0, 1, 2]
## kitti difficulty
DIFFICULTY_CONFIG:
  occlusion: [0,1,1]
  truncation: [0.15,0.3,0.5]
  height: [40.0,25.0,25.0]

#DIFFICULTY_EVAL: True 打开难度分析
#DIFFICULTY:[0,1,2] 所有难度列表
#DIFFICULTY_CONFIG 参考kitti数据集中对难度的设置
4)路径设置
##Data Path settings
EVAL_LIST: "/home/data/kitti/tool/training/val_label_list.txt"

##Groundtruth location
GT_ANNO :
  ROOT_PATH: "/home/data/kitti/tool/training/test_label"
  TYPE: 'GT'

## Detection location
DT_ANNO :
  ROOT_PATH: "/home/data/kitti/tool/training/test_detection/data"
  TYPE : 'DT'

##EVAL_LIST 测试文件的文件名
##GT_ABBO ROOT_PATH:标签的路径,每一帧标签一个label
##DT_ANNO ROOT_PATH:输出结果的路径,每一帧生成一个文件
5)其他设置
IOU_OPT : 0 #iou opt: -1:intersect/union. 0;intersect/GT,1:intersect/DT
DEBUG: False
DEBUG_FRAME_NUM: 3
NUM_TREHSH_SAMPLE : 11 # how many point for ploting
## Result CSV Name
RESULT_ROOT :
RESULT_FILE : '/result.csv'

#IOU_OPT: 0. -1:IOU计算方式:intersect/union。0: intersect/GT。1: intersect/DT
#NUM_TREHSH_SAMPLE : 40  #pr曲线的阈值数目。kitti官方为40
#RESULT_ROOT :   							如果不设置,默认为detectResult同级目录
#RESULT_FILE : '/result.csv'				基本评估的文件名
Step 3:运行
分析系统根目录下运行:
python main.py
基本分析(result.csv)
score_thresh: 检测结果分数阈值。
iou_thresh: 检测结果和标签2d框的交集/并集的阈值。
TP(true positive): 正确检测数目。score_thresh和iou_thresh同时满足,认为一个标签被正确检测到。
FP(false positive): 误检数目。检测框和所有标签无法满足score_thresh和iou_thresh,认为这个检测框是错误的检测框,即误检框。
FP(false negative): 漏检数目。标签和所有的检测框都无法满足score_thresh和iou_thresh,认为这个标签没有被检测到,即漏检框。

Precision(准确率): TP/(TP+FP)
Recall(召回率): TP/(TP+FN)
F1 Score: 2*(precision*recall)/(precision+recall)
PR curve (Precision-Recall Curve): 设置不同的score_tresh, 得到一系列对应的precision和recall。将这些precision和recall绘制成曲线,评价一个模型检测结果的整体性能(不同score_thresh下的整体性能)。
AP (Average Precision):PR曲线下的包含面积。面积越大模型越稳定,性能越好。
PR曲线如蓝色折线,AP为红色区域面积+蓝色区域面积:
| 时间 | 版本号 | 内容 |
|---|---|---|
| 2021.12.15 | v1.0 | baseline |

