Creating Backtraces
Found a crash? Generate a back-trace so we can see exactly where Mixxx crashed.
- Download x64dbg, an open-source x64/x32 debugger for Windows that runs without installation from a folder and support the symbols file mixxx.pdb. (The alternative GDB for Windows is not able to read the pdb file)
- Extract the downloaded zip file into a folder of your choice. (When writing this we get snapshot_2017-03-19_13-21.zip)
- Download Mixxx's debug symbol file:
- 2.0: FIXME
- 2.1: Re-instal Mixxx 2.1 select "Change" and enable "PDB debug files"
- Copy the mixxx.pdb file from the mixxx install folder to the x64dbg
symbols folder, create the folder if not exist
- 64 bit: %PROGRAMFILES%\Mixxx\mixxx.pdb -> snapshot_2017-03-19_13-21\release\x64\symbols
- 32 bit: %PROGRAMFILES(x86)%\Mixxx\mixxx.pdb -> snapshot_2017-03-19_13-21\release\x32\symbols
- Start x64dbg via double click on the bug icon of
- 64 bit: snapshot_2017-03-19_13-21\release\x64\x64dbg.exe
- 32 bit: snapshot_2017-03-19_13-21\release\x32\x32dbg.exe
- Load mixxx.exe: File -> open -> browse to Mixxx.exe (F3)
- 64 bit: %PROGRAMFILES%\Mixxx\mixxx.exe
- 32 bit: %PROGRAMFILES(x86)%\Mixxx\mixxx.exe
- Start and continue Mixxx: Debug -> Run (F9) (three times)
- Make Mixxx crash.
- When it does, Go to the Call Stack View: View -> Call Stack (Ctrl+K)
- Right Click: Copy -> Full Table, To Log
- Go to the log: View -> Log Window (Ctrl+L)
- Right Click: Copy
- Continue below at 6.
- From a command prompt/terminal, type "gdb mixxx" and press Enter.
-
OSX users need to specify the path for the executable file, e.g
gdb /Applications/Mixxx.app/Contents/MacOS/mixxx - Use the gdb "--args" option to pass arguments, e.g.
gdb --args ./mixxx --controllerDebug --developer --resourcePath res
- When the gdb prompt appears, type
set height 0and press enter to disable screen paging. - Type
runand press enter. - Make Mixxx crash. When it does, type the following into the gdb
prompt:
thread apply all bt. (There may be multiple pages of output. Make sure to hit <Enter> enough times to see it all.) - To close the Mixxx window and end gdb, type the following into the
gdb prompt:
quit - Copying the gdb info:
-
Windows users can copy the terminal buffer into a text file:
- Click the window's icon in the top left corner.
- Choose Edit-->Select All. Everything selected will be inverted (so black becomes white, white becomes black, etc) Note: a Windows console will not update while any part of it is selected.
- Press Enter to copy the selection to the clipboard and de-select everything.
- Paste the clipboard buffer into a Notepad text document.
- Attach that to a bug report. (See below.)
- Linux/OSX users should be able to select terminal output by using the mouse, and then doing a right click and selecting Copy.
- Report a bug using the Mixxx bug reporting system on Launchpad. Bugs filed here are tracked by developers and will not fall through the cracks as easily as using the IRC channel or mixxx-devel. (If another bug matches your issue, please make a comment on that one including your system details instead of filing a new bug.) Make sure to attach your back-trace (click Add attachment or patch.) Do not paste it in the comment.
- If you do not want to use Launchpad, post the results in the forum, email them to mixxx-devel, or pastebin them and drop the link on IRC. We'll then try to figure out where the crash is. Do not assume a developer will hear you in IRC, using a static system (bug tracker, e-mail, forum) is much preferred. The IRC channel is great for technical support though.
Note: To get a backtrace for a thread freeze you can do the same thing as above, but to get the gdb prompt, you have to press CTRL+Z in the terminal window to suspend Mixxx.
Apple switched to clang/lldb. Xcode 5 does not include the GNU compiler or tools.
- Open a terminal window.
- Specify the path for the executable file
lldb /Applications/Mixxx.app/Contents/MacOS/mixxx- lldb output should read
Current executable set to '/Applications/Mixxx.app/Contents/MacOS/mixxx' (x86_64) - If want to pass flag-like arguments to Mixxx, you have to terminate
the actual flags with "--"
lldb -- ./mixxx --controllerDebug --developer --resourcePath res
- At the lldb prompt, type
runand press enter. - Make Mixxx crash.
- When it does, type the following into the lldb prompt:
thread backtrace all - To close the Mixxx window and end lldb, type the following at the
lldb prompt:
quit - Copy the lldb output. Select the terminal output by using the mouse, and then doing a right click and selecting Copy
For more informations, go to http://lldb.llvm.org/lldb-gdb.html
When reporting crashes on Windows in addition to the instructions above for creating a backtrace, it is extremely useful if you can provide a "dump" file. This contains important information about why Mixxx crashed and will help the development team find a fix.
To take a crash dump, follow these instructions:
-
When Mixxx crashes, you'll see a dialog similar to the following:
-
Do not click "Close the program"!
-
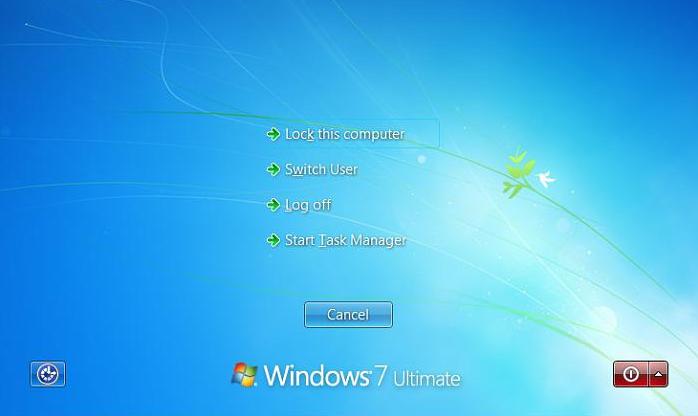
Hit the keys "control", "alt", and "delete" on your keyboard at the same time and click "Start Task Manager" on the screen that follows.
-
 .
.
-
-
Find
mixxx.exein the list of programs, right-click it and hit "Create Dump File". -
The dump file will be located on your computer in
%APPDATA%\..\Local\Temp\mixxx.dmpor similar.-
Tip: You can copy/paste
%APPDATA%\..\Local\Temp\into the start menu search box to open this folder.
-
Tip: You can copy/paste
-
Upload
mixxx.dmp(or whatever the file was called) to the bug report on the Mixxx bug reporting system on Launchpad. -
Important: Dump files must be matched to the exact version of Mixxx you are using. A dump file is useless if we do not know the exact build number of Mixxx you are using and whether Mixxx is 32-bit or 64-bit.
- To find the build number:
- See Help -> About inside of Mixxx and look for
gitXXXX. - OR right-click mixxx.exe -> Properties -> Details -> File
Version and look for a number like
2.1.0.XXXX
- See Help -> About inside of Mixxx and look for
- The easiest way to resolve all confusion is to provide us with
the exact filename of the installer you used to install Mixxx
(and the URL you downloaded it from if you know it). This will
contain both the build number (
gitXXXX) and whether the build is 32-bit or 64-bit.
- To find the build number:


 This is the Mixxx Wiki -
 Mixxx is a free and open-source DJ software.
Manual
Hardware Compatibility
Reporting Bugs
Getting Involved
Contribution Guidelines
Coding Guidelines
Using Git
Developer Guide
Contributing Mappings
Mixxx Controls
MIDI Scripting
Components JS