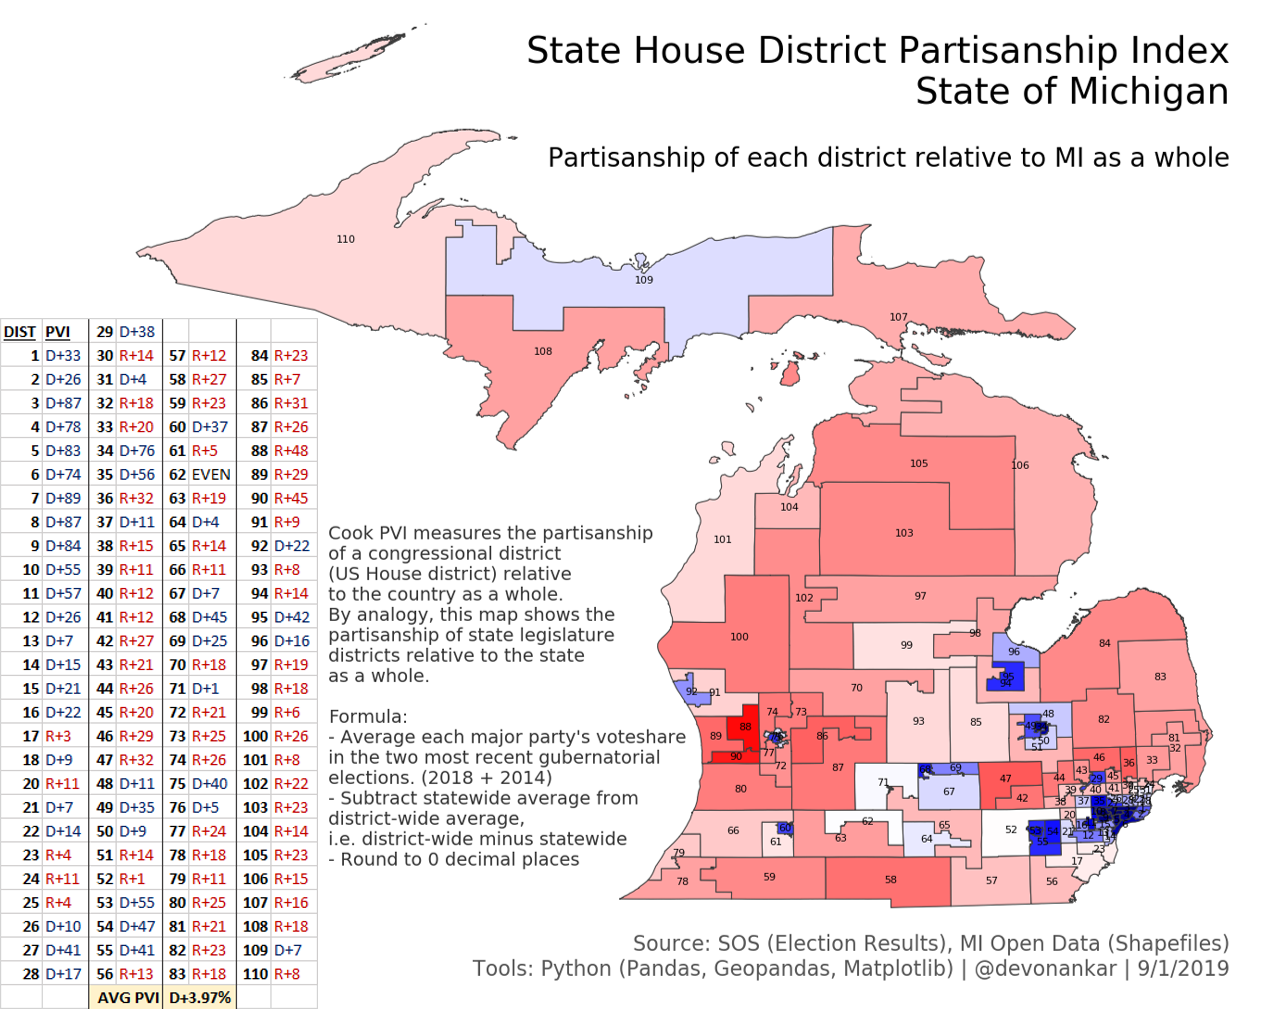
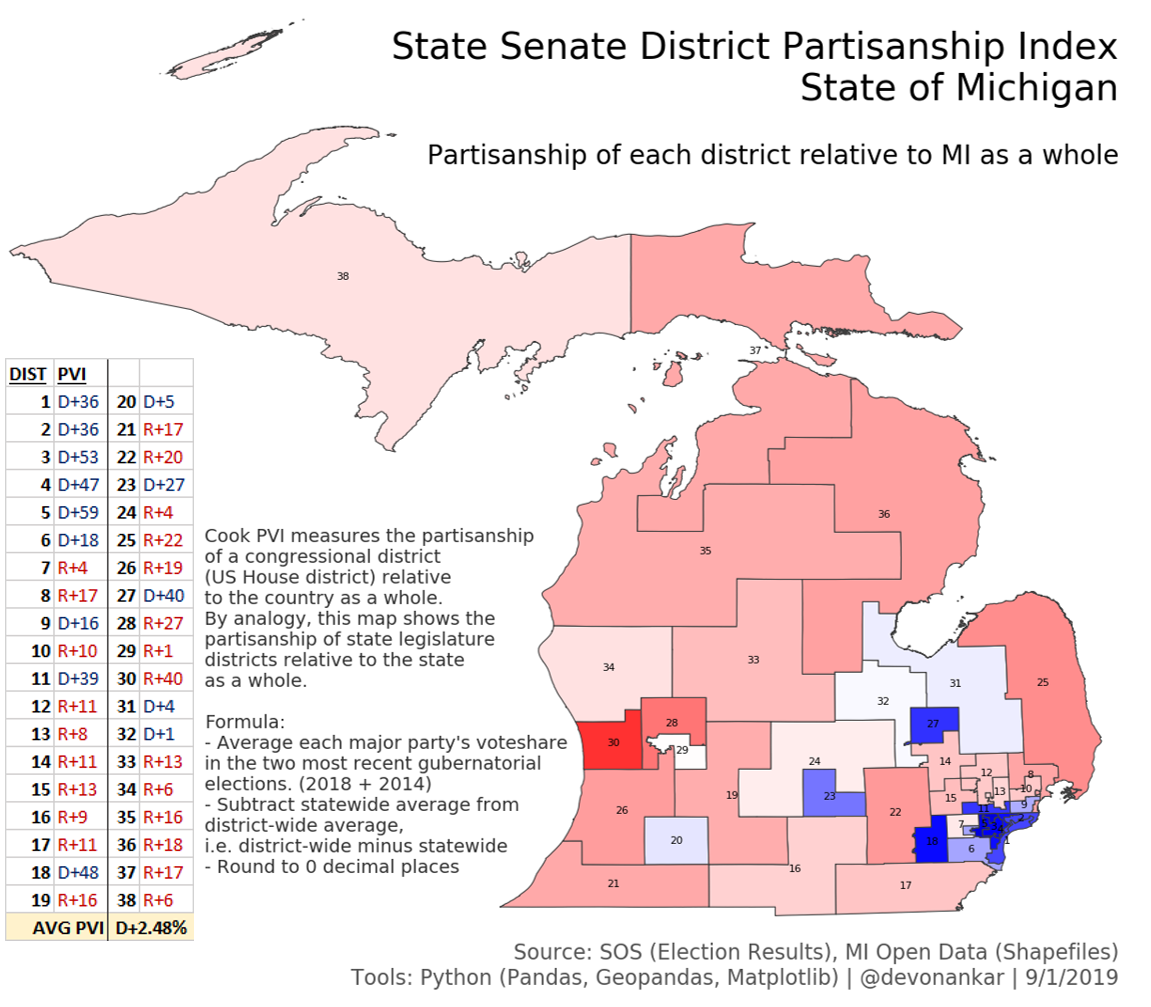
Calculating Cook-PVI-style partisanship index for each State House and State Senate District in the state of Michigan
 |
 |
| HD-19 is missing due to missing precincts in shapefile |
(Click to view)
Summary Tables:
(translated Cook PVI process from national to state level)
- get precinct-level gubernatorial election results for last two elections (2018, 2014) from SOS
- use shapefiles to find out which precincts lie within which state house/senate districts
- split precincts were apportioned based on area lying within each component district
- roll up (sum) election results by state house/senate district (group by)
- average gubernatorial results across both years (unweighted average, i.e. 50/50 weight)
- district-wide (at district level)
- statewide
- subtract statewide average from district-wide average, i.e. district-wide minus statewide
- this captures the difference between district-wide gubernatorial results vs. statewide gubernatorial results, aka partisanship of the district relative to the state as a whole
Note that precinct-level maps do NOT account for turnout! The color/saturation reflects only partisanship, i.e. how Democratic- or Republican-leaning the precinct was in the named election, NOT the number of votes!
2010/2014/2018 are midterm years while 2008/2012/2016 are presidential years. Midterm elections typically have lower voter turnout.
While some districts or precincts appear to have flipped from preferring one major party to preferring the other (and may have flipped back, too!), this can be attributable to a change in turnout as much as to some change in net partisanship. To get the full picture, it is important to look not just at the partisanship maps, but also at the corresponding turnout maps (precinct-level).
Because the data did not merge 100% correctly between the shapefiles and the election results. I made corrections to get as many precincts as I could, but there are still a few stragglers, which show up as white on the maps. Sorry.
governor/president/senate/etc. results by state house/senate districtprecinct-level election results maps- county-level maps for "key" counties - in progress
- compare bluer/redder precincts and their relative turnout change 2016 to 2018 to determine if bluer or redder areas had higher turnout in 2018 (or no difference)
- Python code will be posted soon
Tools: Python - Pandas, Geopandas, Matplotlib
Contact: devon@ankar.io
Last Update: 11/15/2019