-
Notifications
You must be signed in to change notification settings - Fork 42
Gdal_landsat_pansharp
This program combines the color from low resolution bands with the texture from a high resolution panchromatic band. It works well with Landsat 7, hence the name, however it can be applied to other sensors as well. The algorithm is primitive, but judging from a few experiments it seems to work as well or better than competitors (and it is very fast).
Usage:
 gdal_landsat_pansharp
      -rgb <src_rgb.tif> [ -rgb <src.tif> ... ]
      [ -lum <lum.tif> <weight> ... ] -pan <pan.tif>
      [ -ndv <nodataval> ] -o <out-rgb.tif>
Where:
    rgb.tif    Source bands that are to be enhanced
    lum.tif    Bands used to simulate lo-res pan band
    pan.tif    Hi-res panchromatic band
Examples:
    gdal_landsat_pansharp -rgb lansat321.tif -lum landsat234.tif 0.25 0.23 0.52 \
      -pan landsat8.tif -ndv 0 -o out.tif

    gdal_landsat_pansharp -rgb landsat3.tif -rgb landsat2.tif -rgb landsat1.tif \
      -lum landsat2.tif 0.25 -lum landsat3.tif 0.23 -lum landsat4.tif 0.52 \
      -pan landsat8.tif -ndv 0 -o out.tif

    gdal_landsat_pansharp -rgb quickbird_rgb.tif -pan quickbird_pan.tif -o out.tif
I don't remember where this algorithm came from. If you know the name for this or have a paper I can cite let me know! The inputs consist of low resolution color bands, a high resolution panchromatic band, and low resolution bands used for building a simulated panchromatic band. Suppose the program is invoked like
   gdal_landsat_pansharp -rgb landsat3.tif -rgb landsat2.tif -rgb landsat1.tif \
     -lum landsat2.tif 0.25 -lum landsat3.tif 0.23 -lum landsat4.tif 0.52 \
     -pan landsat8.tif -ndv 0 -o out.tif
Or equivalently, if you have three bands per file,
   gdal_landsat_pansharp -rgb lansat321.tif -lum landsat234.tif 0.25 0.23 0.52 \
     -pan landsat8.tif -ndv 0 -o out.tif
In this example bands 3, 2, and 1 are used for red, green, and blue. Bands 2, 3, and 4 are used to make the simulated panchromatic band, with weighting factors 0.25, 0.23, and 0.52. These numbers work well for Landsat 7. They came from this paper. I'll get to what these options do in a bit. But first I'd just like to mention that if you don't specify the '-lum' option then the bands from the '-rgb' option are used with equal weights. This works okay if you don't know what coefficients to use to make a good simulated pan band.
All of the low resolution bands are scaled up to match the resolution of the panchromatic band, using cubic interpolation. The bands passed to the '-lum' parameter get combined using the given weights to produce a simulated panchromatic band. The coefficients must be chosen in order to simulate the spectral response of the panchromatic band (see the paper linked to above for more details). The ratio of the real panchromatic band to the simulated one essentially gives 'texture'. This texture is multiplied by the red, green, blue bands to produce the output.
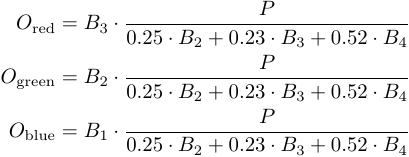
Mathematically, it goes like this. Let P be the panchromatic band, let B be the other input bands, and let O be the output bands. With the parameters from the example above, the output is

A word about why this works. The goal is to combine the color of the low res bands with the texture of the high res pan band. Your first instinct may be "just take the color of the low res bands and the brightness of the high res band and you're done". The problem is that the Landsat 7 pan band doesn't sense the same wavelengths as the human eye (other satellites typically have similar issues). So something might be bright on the pan band even though it wouldn't naturally appear bright. What we need is to take from the pan band not the brightness but rather the texture. Compute the ratio of the pan band versus a simulated low resolution version of the pan band. Call this the "texture" (there may be a technical name, but I don't know it). Notice that multiplying the texture times the low res simulated pan band would just bring you back to the high res pan band (since multiplying undoes dividing). Similarly, multiplying the texture times one of the red, green, or blue bands gives something resembling what that band "would have" looked like if it was high res. Or so goes the intuition.
Now, at this point you may be wondering, as I am now, why it is necessary to make the simulated panchromatic band by mixing together some low resolution bands. It seems like a blurred version of the pan band would work just as well. The answer is that there is probably a good reason, the way I use probably works better, but I don't at all remember why! My guess is that the simulated pan band needs to mimick the blurryness of the input RGB bands. Just blurring it out requires knowing exactly how Landsat's low res bands relate to the high res bands in terms of how much of Earth each pixel sees, how blurry it is and all that. By making the simulated pan band out of the low res bands you get something that looks like what the pan band would look like had it been captured by a low resolution sensor with the same characteristics as the other low res sensors. Well, that's probably a load of BS, but at least it sounds true and that's what counts.