-
Notifications
You must be signed in to change notification settings - Fork 42
Tracing out valid region of an aerial photo
Here is the image. There are a number of issues with this image which prevent it from being used in a mosaic. Around the photograph there is text, a stopwatch, perhaps some fiducial markers, and a sticker. Around that is a thin white border (but not 255 white, that would be too easy). This has been warped to correct for the shape of the terrain, and then a black border has been added. For some reason, a white border has been added around that. Who knows why. The goal is to create a mask of just the pixels which represent Earth.
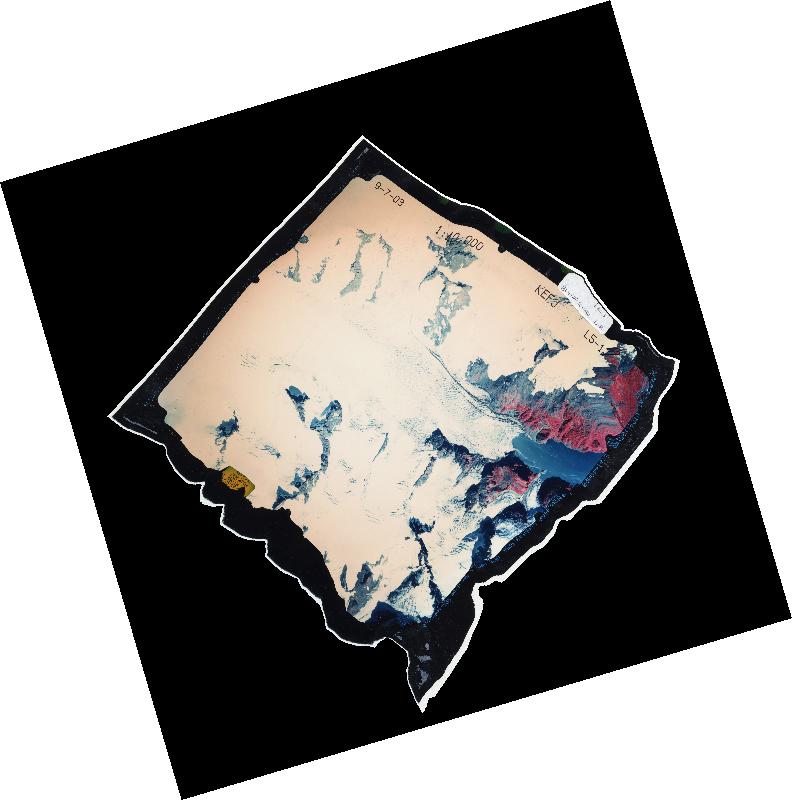
First, specify that black (0) is a no-data value by running:
gdal_trace_outline -ndv 0 -report report.ppm input.tif
The -report option produces a preview image showing what the tracer found.
No other output options have been specified so far, so the report is the only
thing produced for now. Only ppm format is supported for reports.
The cyan regions represent input points that are considered valid, and black represents
invalid points. The yellow lines represent the outlines that the tracer has found.
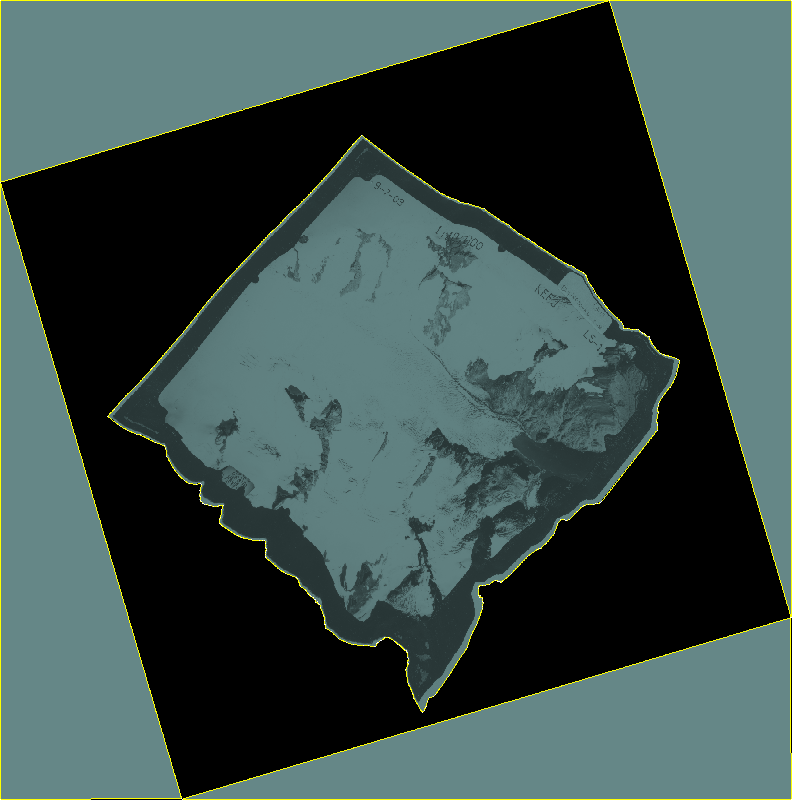
To remove the white border, specify a second no-data value of 255.
gdal_trace_outline -ndv 0 -ndv 255 -report report.ppm input.tif
You can see that only the central portion remains.
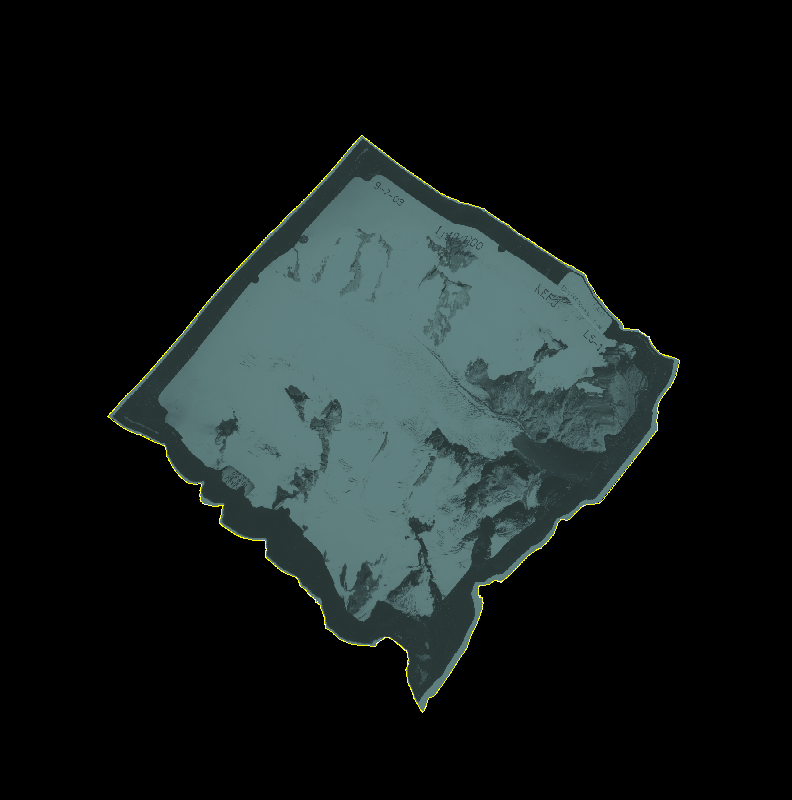
Now it is time to deselect the dark border around the image. Unfortunately, it is not really
all that dark, and so a rather wide range of no-data values needs to be used. In fact, in order
to completely separate the central image from the thin white border that surrounds it, it is necessary
to exclude values in the 0..100 range:
gdal_trace_outline -ndv 0..100 -ndv 255 -report report.ppm input.tif
In order to exclude the thin white border, we could exclude the 200..255 color range, but unfortunately
this would also exclude all of the snow-covered mountains. So we deal with the border later on.
Below is the report from this iteration. Again the yellow borders represent the outlines found by the tracer. But now there are also red borders. These represent the holes of the polygons (so the area within the red borders is not part of the selected region).
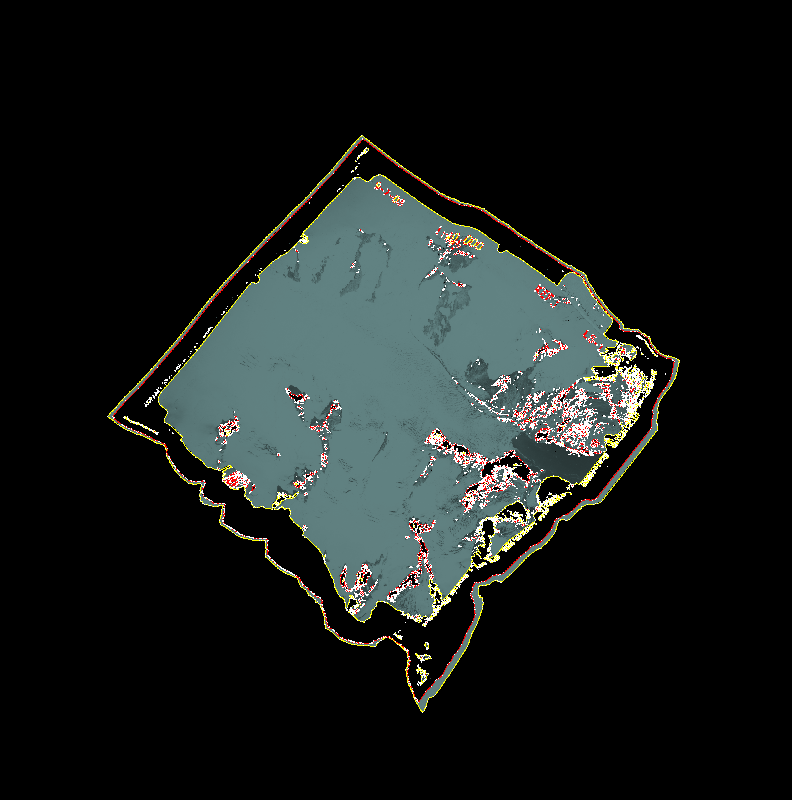
As you can see, there is a bit of a problem now. By excluding the color range 0..100, a lot of regions that should
be valid have been removed. Also, near the bottom corner, there are little islands that have been selected. I think these
are mountains that were bright enough that they shone through the dark border that was placed around the image (but I have
no idea how this image was produced in reality).
To fix both of these problems (the little holes and the little islands), pass the option -min-ring-area 10000. This
will remove all holes and islands that are smaller than 10000 pixels. Getting rid of these also decreases the amount
of work the script must do when you start using more complicated options.
gdal_trace_outline -ndv 0..100 -ndv 250..255 -report report.ppm \
	-min-ring-area 10000 input.tif
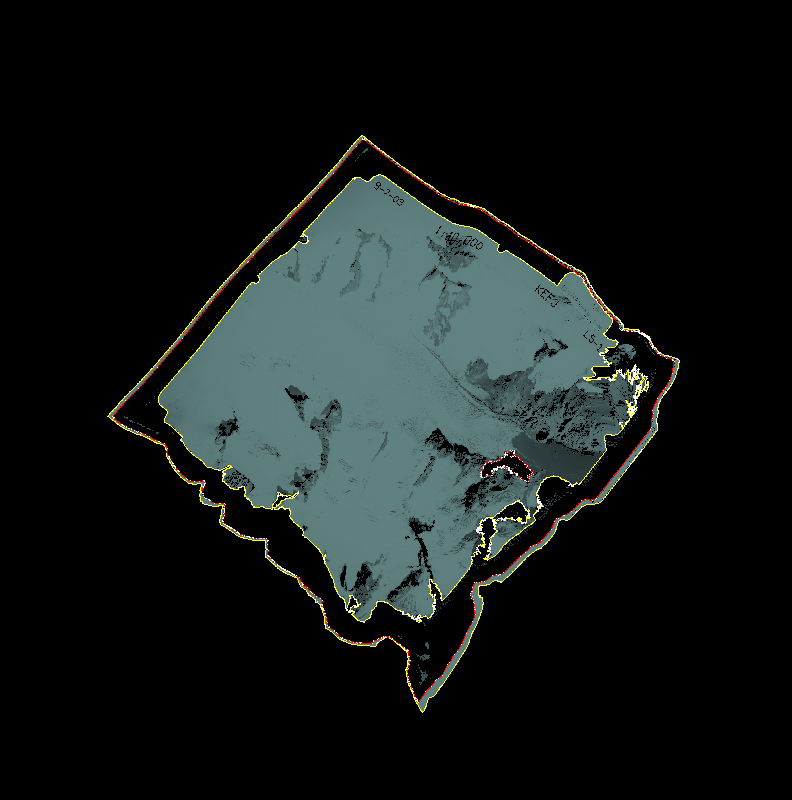
Almost there! It is now down to two contiguous regions: the central image and the thin border that surrounds it.
To select just the image, pass the -containing percent 50 50 option. This will select only the polygon that
contains the point that is located at 50% of the image width and 50% of the image height (i.e. the center of the image).
You can also specify x/y coordinates, easting/northing, or longitude/latitude. There is also a -not-containing option
that selects only polygons not containing a specified point. You can use either of these options as many times as
you like to select/deselect multiple points.
gdal_trace_outline -ndv 0..100 -ndv 250..255 -report report.ppm \
	-min-ring-area 10000 -containing percent 50 50 input.tif
As you can see, only the central region has been selected (although it still has a hole in it). Note the green dot
in the center. This is the point that we passed to the -containing option. Points passed to the -not-containing
option are drawn in red.
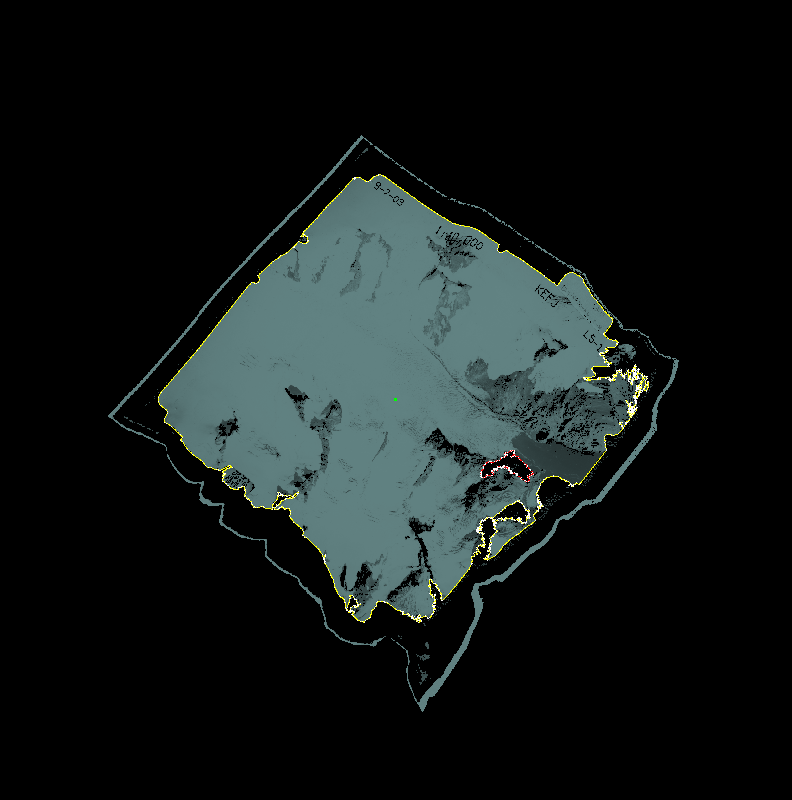
Now its time to git rid of the hole in the center. To do this, simply pass the -no-donuts option.
This fills in all of the holes.
gdal_trace_outline -ndv 0..100 -ndv 250..255 -report report.ppm \
	-min-ring-area 10000 -containing percent 50 50 -no-donuts input.tif
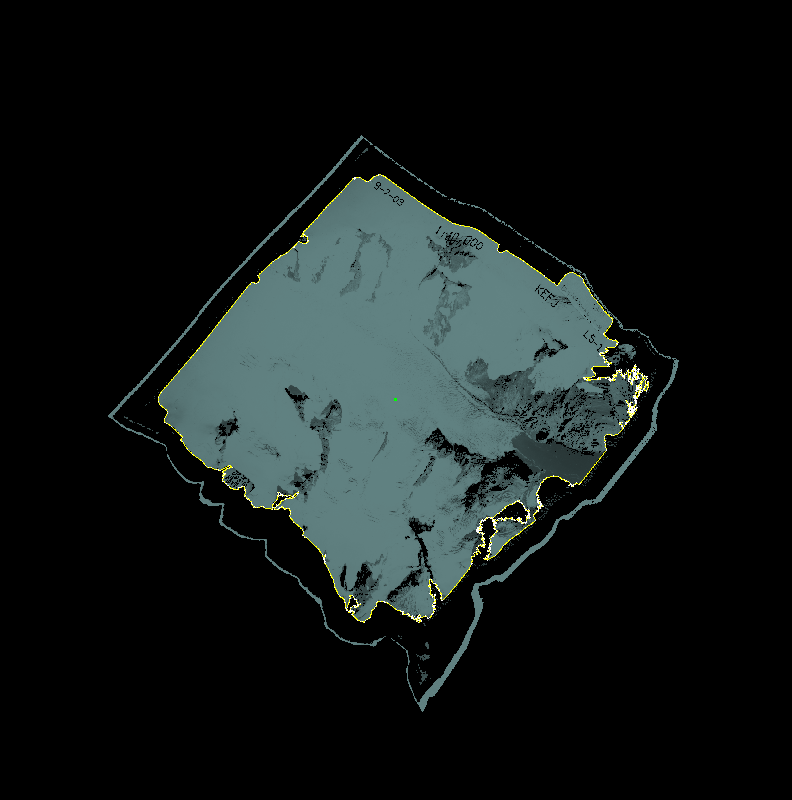
And there you have it! Only the desired region is selected. Of course we still have to output the mask or shapefile, which will
be next. Also, there are some "inverse peninsulas" that have eaten into the image. This can be fixed to some extent by using
the -pinch-excursions option, although it can be quite slow and may possibly end up including a bit of the no-data regions. The
results are shown below, but for the final run I am not going to use this option. Since this image will be part of a mosaic, the hope
is that any regions that I leave out now will be filled in by another image.
gdal_trace_outline -ndv 0..100 -ndv 250..255 -report report.ppm \
	-min-ring-area 10000 -containing percent 50 50 -no-donuts -pinch-excursions input.tif
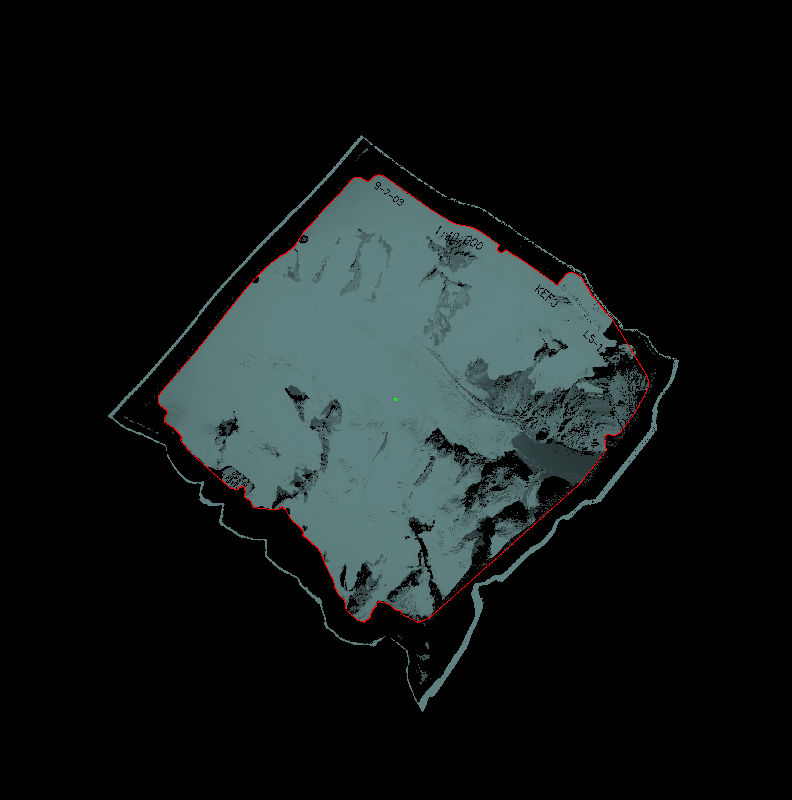
Now it is time to save the results. To save a shapefile containing easting/northing values, use the option
-out-cs en -ogr-out region.shp. You can also use x/y coordinates or lon/lat coordinates, and you can output
WKT instead of shapefile if you prefer.
gdal_trace_outline -ndv 0..100 -ndv 250..255 -report report.ppm \
	-min-ring-area 10000 -containing percent 50 50 -no-donuts \
	-out-cs en -ogr-out region.shp input.tif
By default, the complexity of the shapefile is reduced by removing as many
vertices as possible without messing up the border by more than 2 pixels. This
tolerance can be configured via the -dp-toler option, or you can use
-dp-toler 0 to skip this step and end up with a shapefile that traces around
each individual pixel.
If two parts of a polygon touch each other on a single corner, one of them
will have the very edge of the corner beveled off to avoid self-intersection.
This is done because many programs choke when a polygon ring touches itself on
a single point. You can turn this off by using the -bevel-size 0 option.
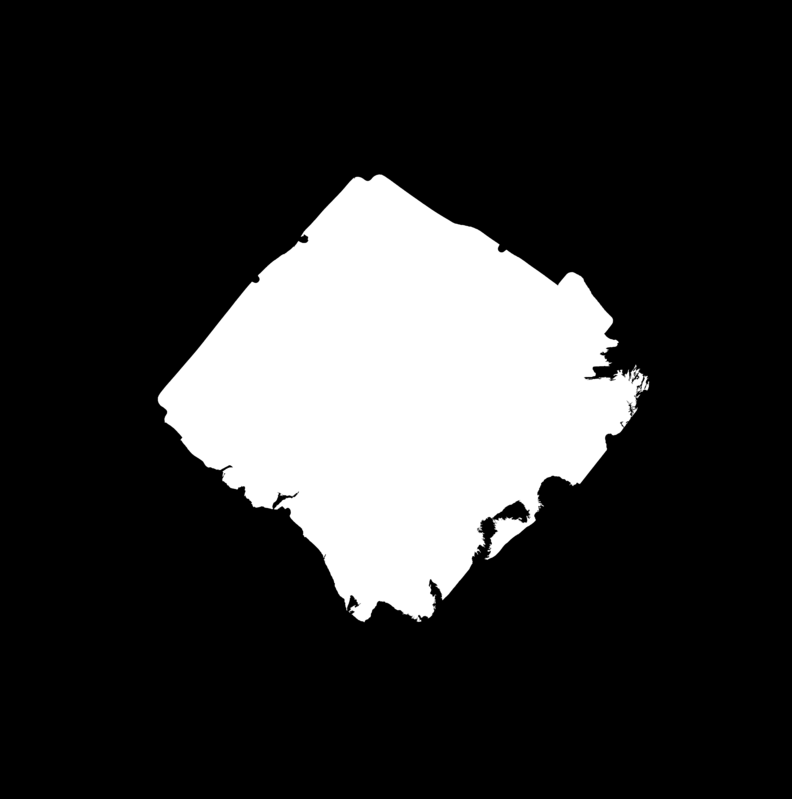
Maybe instead of a shapefile, you would rather have a bitmap that represents
the mask. For this, use the -mask-out option. The output format is pbm
but you can convert it to whatever you like by using the pnmto* commands of
the netpbm library which is available on most systems.
When the goal is to produce a bitmap mask, it does not make sense to do the
polygon simplification step. So use the option -dp-toler 0 to turn that off.
Here is the full command:
gdal_trace_outline -ndv 0..100 -ndv 250..255 -report report.ppm \
	-min-ring-area 10000 -containing percent 50 50 -no-donuts \
	-dp-toler 0 -mask-out mask.pbm input.tif
To convert it to a PNG (which GDAL can read):
pnmtopng < mask.pbm > mask.png
Here is what it looks like:
Unfortunately I don't have a tool available that will combine the original
image with the mask, blacking out regions not in the mask. I think you can
do this with netpbm if you are tricky enough. My gdal_merge_vrt script
can add the mask as an alpha channel, but from there I don't know how to
actually blacken the removed pixels.
Comment by dshean, 6/30/2012:
Great tutorial Dan. I've always had do tackle this problem manually, and it's never fun. The last part should be pretty easy to accomplish. Scale the values in your mask (e.g. DN/255) so the valid regions have a value of 1 and nodata regions are still 0, then multiply the mask and the original dataset. This can be done with gdal_calc.py, numpy, or your favorite raster calculator.