JavaScript Debugger
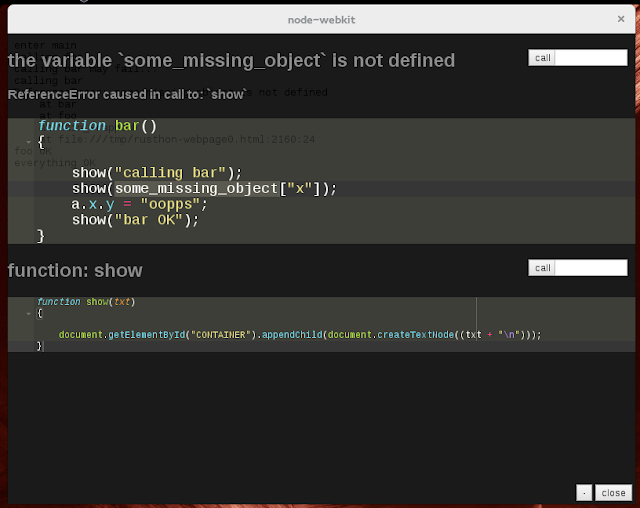
By default the Javascript backend will transpile your code and insert runtime checks to catch any errors thrown for each expression in your code. When an uncaught error is thrown, the runtime checker will trap the error and parse the trace-back and display it in human readable form inside an HTML based debug overlay. The debug overlay also displays the source code of the caller and callee functions that raised the exception, you can edit this code and it will update the live functions (no need to recompile and reload your app). This allows you to quickly fix your code, and bypass having to use the Chrome Developer Tools.
note: to remove the runtime checking and debugger overhead, transpile your project with the command line option --release
If you want to have syntax highlighted source code, the debugger will automatically use the Ace.js Editor if it is found, otherwise fallback to using a normal HTML TextArea.
To quickly get a build of ace and include it in your project, run these commands:
cd
git clone https://github.com/ajaxorg/ace-builds.git
And then include this HTML into your markdown in the head section.
<script src="~/ace-builds/src-min/ace.js" type="text/javascript"></script>
<script src="~/ace-builds/src-min/theme-monokai.js" type="text/javascript"></script>
<script src="~/ace-builds/src-min/worker-javascript.js" type="text/javascript"></script>
<script src="~/ace-builds/src-min/mode-javascript.js" type="text/javascript"></script>
NW.js (aka NodeWebkit) is a custom Chrome with NodeJS, and includes some extra things that make debugging easier. The transpiler is hardcoded to look for NW.js (nwjs-v0.12.2-linux-x64) in your home directory, and if it is found it will generate a package for you and run it. If your main entry point function is decorated with @debugger this will bring up the Chrome Developer Tools window, and then run your function. Note: the DevTools window will not open in regular GoogleChrome when using this decorator.
@debugger
def myentrypoint():
   ...
The debugger can also be configured to use breakpoint and halt your program when an unexpected error is thrown. Set debugger.breakpoints to True.
debugger.breakpoints = TrueExamples: