-
Notifications
You must be signed in to change notification settings - Fork 5k
New issue
Have a question about this project? Sign up for a free GitHub account to open an issue and contact its maintainers and the community.
By clicking “Sign up for GitHub”, you agree to our terms of service and privacy statement. We’ll occasionally send you account related emails.
Already on GitHub? Sign in to your account
高性能 React:3 个新工具加速你的应用 #1911
Merged
Merged
高性能 React:3 个新工具加速你的应用 #1911
Changes from 3 commits
Commits
Show all changes
5 commits
Select commit
Hold shift + click to select a range
File filter
Filter by extension
Conversations
Failed to load comments.
Loading
Jump to
Jump to file
Failed to load files.
Loading
Diff view
Diff view
There are no files selected for viewing
This file contains bidirectional Unicode text that may be interpreted or compiled differently than what appears below. To review, open the file in an editor that reveals hidden Unicode characters.
Learn more about bidirectional Unicode characters
| Original file line number | Diff line number | Diff line change |
|---|---|---|
|
|
@@ -3,62 +3,62 @@ | |
| > * 原文作者:[Ben Edelstein](https://medium.freecodecamp.org/@edelstein) | ||
| > * 译文出自:[掘金翻译计划](https://github.com/xitu/gold-miner) | ||
| > * 本文永久链接:[https://github.com/xitu/gold-miner/blob/master/TODO/make-react-fast-again-tools-and-techniques-for-speeding-up-your-react-app.md](https://github.com/xitu/gold-miner/blob/master/TODO/make-react-fast-again-tools-and-techniques-for-speeding-up-your-react-app.md) | ||
| > * 译者: | ||
| > * 校对者: | ||
| > * 译者:[sunui](https://github.com/sunui) | ||
| > * 校对者:[yzgyyang](https://github.com/yzgyyang)、[reid3290](https://github.com/reid3290) | ||
|
|
||
| # High Performance React: 3 New Tools to Speed Up Your Apps | ||
| # 高性能 React:3 个新工具加速你的应用 | ||
|
|
||
|  | ||
|
|
||
| React is usually pretty fast, but it’s easy to make small mistakes that lead to performance issues. Slow component mounts, deep component trees, and unnecessary render cycles can quickly add up to an app that feels slow. | ||
| 通常来说 React 是相当快的,但开发者也很容易犯一些错误导致出现性能问题。组件挂载过慢、组件树过深和一些非必要的渲染周期可以迅速地联手拉低你的应用速度。 | ||
|
|
||
| Luckily there are lots of tools, some even built in to React, that help with diagnosing performance issues. In this post I’ll highlight tools and techniques for making React apps fast. Each section also has an interactive, and (hopefully) fun demo! | ||
| 幸运的是有大量的工具,甚至有些是 React 内置的,可以帮助我们检测性能问题。本文将着重介绍一些加快 React 应用的工具和技术。每一部分都配有一个可交互而且(希望是)有趣的 demo! | ||
|
|
||
| ### Tool #1: The Performance Timeline | ||
| ### 工具 #1: 性能时间轴 | ||
|
|
||
| React 15.4.0 introduced a new performance timeline feature that lets you see exactly when components get mounted, updated, and unmounted. It also lets you visualize component lifecycles in relation to each other. | ||
| React 15.4.0 引入了一个新的性能时间轴特性,可以精确展示组件何时挂载、更新和卸载。也可以让你可视化地观察组件生命周期相互之间的关系。 | ||
|
|
||
| **Note:** For now, this feature only works in Chrome, Edge, and IE, since it leverages the User Timing API which has yet to be implemented in all browsers. | ||
| **注意:** 目前,这一特性仅支持 Chrome、Edge 和 IE,因为它调用的 User Timing API 还没有在所有浏览器中实现。 | ||
|
|
||
| #### How it works | ||
| #### 如何使用 | ||
|
|
||
| 1. Open your app and append the query param: `react_perf`. For example, `[http://localhost:3000?react_perf](http://localhost:3000?react_perf)` | ||
| 2. Open the Chrome DevTools **Performance** tab and press **Record**. | ||
| 3. Perform the actions that you want to analyze. | ||
| 4. Stop recording. | ||
| 5. Inspect the visualization under **User Timing.** | ||
| 1. 打开你的应用并追加一个参数:`react_perf`。例如, [`http://localhost:3000?react_perf`](http://localhost:3000?react_perf) | ||
| 2. 打开 Chrome 开发者工具 **Performance** 栏并点击 **Record**。 | ||
| 3. 执行你想要分析的操作。 | ||
| 4. 停止记录。 | ||
| 5. 观察 **User Timing** 选项下的可视化视图。 | ||
|
|
||
|  | ||
|
|
||
| #### Understanding the output | ||
| #### 理解输出结果 | ||
|
|
||
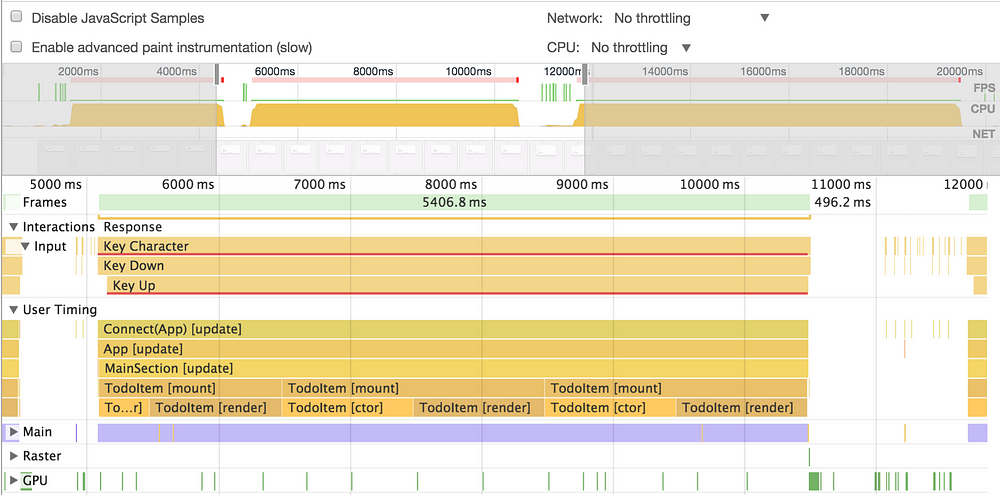
| Each colored bar shows time that a component is doing “work”. Since JavaScript is single-threaded, whenever a component is mounting or rendering, it’s hogging the main thread and preventing other code from running. | ||
| 每一个色条显示的是一个组件做“处理”的时间。由于 JavaScript 是单线程的,每当一个组件正在挂载或渲染,它都会霸占主线程,并阻塞其他代码运行。 | ||
|
|
||
| The text in brackets like `[update]` describes which part of the component lifecycle is taking place. The timeline breaks down each step, so you can see fine-grained timings on methods like `[componentDidMount]``[componentWillReceiveProps]``[ctor]` (constructor) and `[render].` | ||
| 像 `[update]` 这样中括号内的文字描述的是声命周期的哪一个阶段正在发生。把时间轴按照步骤分解,你可以看到依据方法的细粒度的计时,比如 `[componentDidMount]` `[componentWillReceiveProps]` `[ctor]` (constructor) 和 `[render]`。 | ||
|
|
||
| Bars that are stacked represent component trees. While it is typical to have fairly deep component trees in React, if you are optimizing a component that is mounted frequently, it can help to reduce the number of wrapper components since each adds a small performance and memory penalty. | ||
| 堆叠的色条代表组件树,虽然在 React 拥有过深的组件树也比较典型,但如果你想优化一个频繁挂载的组件,减少嵌套组件的数量也是有帮助的,因为每一层都会增加少量的性能和内存消耗。 | ||
|
|
||
| One caveat here is that the timing numbers in the timeline are for the development build of React, which is much slower than prod. In fact, the performance timeline itself even slows down your app. While these numbers shouldn’t be considered representative of real-world performance, the *relative *timings between different components are accurate. Also, whether or not a component updates at all is not dependent on a prod build. | ||
| 这里需要注意的是时间轴中的计时时长是针对 React 的开发环境构建的,会比生产环境慢很多。实际上性能时间轴本身也会拖慢你的应用。虽然这些时长不能代表真正的性能指标,但不同组件间的**相对**时间是精确的。而且一个组件是否完全被更新不取决于是否是生产环境的构建。 | ||
|
|
||
| #### Demo #1 | ||
|
|
||
| For fun, I rigged the TodoMVC app to have some *serious *performance problems. You can [try it out here](https://perf-demo.firebaseapp.com/?react_perf). | ||
| 出于乐趣,我故意写了一个具有**严重**性能问题的 TodoMVC 应用。你可以[在这里尝试](https://perf-demo.firebaseapp.com/?react_perf)。 | ||
|
|
||
| To see the timeline, open the Chrome dev tools, go to the “Performance” tab, and click Record. Then add some TODOs in the app, stop the recording, and inspect the timeline. See if you can spot which components are causing the performance problems :) | ||
| 打开 Chrome 开发者工具,切换到 “Performance” 栏,点击 Record 开始记录时间轴。然后在应用中添加一些 TODO,停止记录,检查时间轴。看看你能不能找出造成性能问题的组件 :) | ||
|
|
||
| ### Tool #2: why-did-you-update | ||
|
|
||
| One of the most common issues that affects performance in React is unnecessary render cycles. By default, React components will re-render whenever their parent renders, even if their props didn’t change. | ||
| 在 React 中最影响性能的问题之一就是非必要的渲染周期。默认情况下,一旦父组件渲染,React 组件就会跟着重新渲染,即使它们的 props 没有变化也是如此。 | ||
|
|
||
| For example, if I have a simple component like this: | ||
| 举个例子,如果我有一个简单的组件长这样: | ||
|
|
||
| class DumbComponent extends Component { | ||
| render() { | ||
| return <div> {this.props.value} </div>; | ||
| } | ||
| } | ||
|
|
||
| With a parent component like this: | ||
| 它的父组件是这样: | ||
|
|
||
| class Parent extends Component { | ||
| render() { | ||
|
|
@@ -68,20 +68,20 @@ With a parent component like this: | |
| } | ||
| } | ||
|
|
||
| Whenever the parent component renders, `DumbComponent` will re-render, despite its props not changing. | ||
| 每当父组件渲染,`DumbComponent` 就会重新渲染,尽管它的 props 没有改变。 | ||
|
|
||
| Generally, if `render` runs, and there were no changes to the virtual DOM, it is a wasted render cycle since the `render` method should be pure and not have any side effects. In a large-scale React app, it can be tricky to detect places where this happens, but luckily, there’s a tool that can help! | ||
| 一般来讲,如果 `render` 运行,并且虚拟 DOM 没有改变,而且既然 `render` 应该是个纯净的没有任何副作用的方法,那么这就是一个不必要的渲染周期。在一个大型应用中检测这种事情是非常困难的,但幸运的是有一个工具可以帮得上忙。 | ||
|
|
||
| #### Using why-did-you-update | ||
| #### 使用 why-did-you-update | ||
|
|
||
|  | ||
|
|
||
| `why-did-you-update` is a library that hooks into React and detects potentially unnecessary component renders. It detects when a component’s `render` method is called despite its props not having changed. | ||
| `why-did-you-update` 是一个 React 钩子工具,用来检测潜在的非必要组件渲染。它会检测到被调用但 props 没有改变的组件 `render`。 | ||
|
|
||
| #### Setup | ||
| #### 安装 | ||
|
|
||
| 1. Install with npm: `npm i --save-dev why-did-you-update` | ||
| 2. Add this snippet anywhere in your app: | ||
| 1. 使用 npm 安装: `npm i --save-dev why-did-you-update` | ||
| 2. 在你应用中的任何地方添加下面这个片段: | ||
|
|
||
| import React from 'react' | ||
|
|
||
|
|
@@ -90,73 +90,73 @@ Generally, if `render` runs, and there were no changes to the virtual DOM, it is | |
| whyDidYouUpdate(React) | ||
| } | ||
|
|
||
| **Note** that this tool is great in local development but make sure it’s disabled in production since it will slow down your app. | ||
| **注意:**这个工具在本地开发环境使用起来非常棒,但是要确保生产环境要禁用掉,因为它会拖慢你的应用。 | ||
|
There was a problem hiding this comment. Choose a reason for hiding this commentThe reason will be displayed to describe this comment to others. Learn more. |
||
|
|
||
| #### Understanding the output | ||
| #### 理解输出结果 | ||
|
|
||
| `why-did-you-update` monitors your app as it runs and logs components that may have changed unnecessarily. It lets you see the props before and after a render cycle it determined may have been unnecessary. | ||
| `why-did-you-update` 在运行时监听你的应用,并用日志输出可能存在非必要更新的组件。它让你看到一个渲染周期前后的 props 对比,来决定是否可能存在非必要的更新。 | ||
|
|
||
| #### Demo #2 | ||
|
|
||
| To demonstrate `why-did-you-update`, I installed the library in the TodoMVC app on Code Sandbox, an online React playground. Open the browser console and add some TODOs to see the output. | ||
| 为了演示 `why-did-you-update`,我在 TodoMVC 中安装了这个库并放在 Code Sandbox 网站上,这是一个在线的 React 练习场。 打开浏览器控制台,并添加一些 TODO 来查看输出。 | ||
|
|
||
| [Here’s the demo](https://codesandbox.io/s/xGJP4QExn). | ||
| [这里查看 demo](https://codesandbox.io/s/xGJP4QExn)。 | ||
|
|
||
| Notice that a few components in the app are rendering unnecessarily. Try implementing the techniques described above to prevent unnecessary renders. If done correctly, there should be no output from `why-did-you-update` in the console. | ||
| 注意这个应用中很少的组件存在非必要渲染。尝试执行上述的技术来避免非必要渲染,如果操作正确,`why-did-you-update` 不会在控制台输出任何内容。 | ||
|
|
||
| ### Tool #3: React Developer Tools | ||
|
|
||
|  | ||
|
|
||
| The React Developer Tools Chrome extension has a built-in feature for visualizing component updates. This is helpful for detecting unnecessary render cycles. To use it, first make sure to [install the extension here](https://codesandbox.io/s/xGJP4QExn). | ||
| React Developer Tools 这个 Chrome 扩展有一个内置特性用来可视化组件更新。这有助于防止非必要的渲染周期。使用它,首先要确保[在这里安装了这个扩展](https://codesandbox.io/s/xGJP4QExn)。 | ||
|
|
||
| Then, open the extension by clicking the “React” tab in the Chrome DevTools and check “Highlight Updates”. | ||
| 然后点击 Chrome 开发者工具中的 “React” 选项卡打开扩展并勾选“Highlight Updates”。 | ||
|
|
||
|  | ||
|
|
||
| Then, simply use your app. Interact with various components and watch the DevTools work its magic. | ||
| 然后简单操作你的应用。和不同的组件交互并观察 DevTools 施展它的魔法。 | ||
|
|
||
| #### Understanding the output | ||
| #### 理解输出结果 | ||
|
|
||
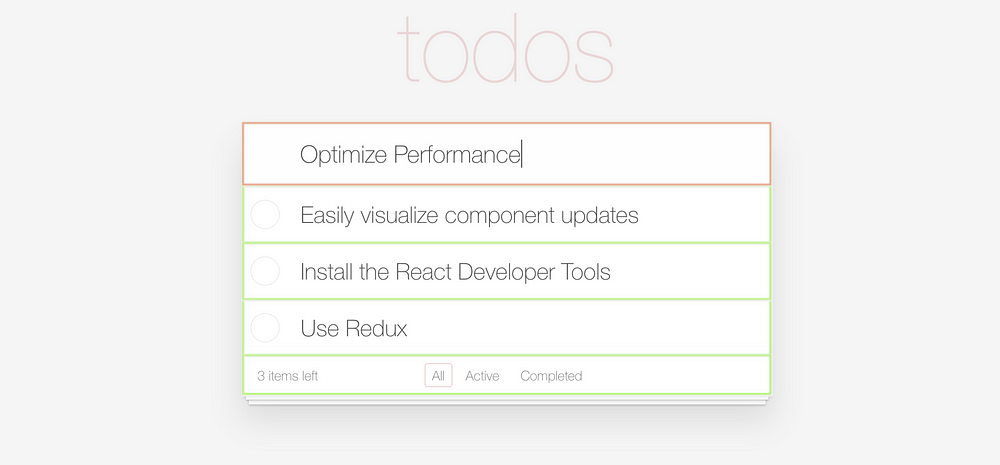
| The React Developer Tools highlights components that are re-rendering at a given point in time. Depending on the frequency of updates, a different color is used. Blue shows infrequent updates, ranging to green, yellow, and red for components that update frequently. | ||
| React Developer Tools 在给定的时间点高亮正在重新渲染的组件。根据更新的频率,使用不同的颜色。蓝色显示罕见更新,经过绿色、黄色的过渡,一直到红色用来显示更新频繁的组件。 | ||
|
|
||
| Seeing yellow or red isn’t *necessarily* a bad thing. It would be expected when adjusting a slider, or other UI element that triggers frequent updates. But if you click a simple button and see red- it may mean that something is awry. The purpose of the tool is to spot components that are updating *unnecessarily*. As the app developer, you should have a general idea which components should be updating at a given time. | ||
| 看到黄色或红色并不**必要**觉得一定是坏事。它可能发生在调整一个滑块或频繁触发更新的其他 UI 元素,这属于意料之中。但如果当你点击一个简单的按钮并且看到了红色这可能就意味着事情不对了。这个工具的目的就是识破正在发生**非必要**更新的组件。作为应用的开发者,你应该对给定时间内哪个组件应该被更新有一个大体的概念。 | ||
|
|
||
| #### Demo #3 | ||
|
|
||
| To demonstrate the component highlighting, I rigged the TodoMVC app to update some components unnecessarily. | ||
| 为了演示高亮,我故意让 TodoMVC 应用更新一些非必要的组件。 | ||
|
|
||
| [Here’s the demo](https://highlight-demo.firebaseapp.com/). | ||
| [这里查看 demo](https://highlight-demo.firebaseapp.com/)。 | ||
|
|
||
| Open the link above, and then open the React Developer Tools and enable update highlighting. When you type in the top text input, you’ll see all of the TODOs highlight unnecessarily. As you type faster, you’ll see the color change to indicate more frequent updates. | ||
| 打开上面的链接,然后打开 React Developer Tools 并启用更新高亮。当你在上面的文字输入框中输入内容时,你将看到所有的 TODO 非必要地高亮。你输入得越快,你会看到颜色变化指示更新越来越频繁。 | ||
|
|
||
| ### Fixing unnecessary renders | ||
| ### 修复非必要渲染 | ||
|
|
||
| Once you’ve identified components in your app that are re-rendering unnecessarily, there are a few easy fixes. | ||
| 一旦你已经确定应用中非必要重新渲染的组件,有几种简单的方法来修复。 | ||
|
|
||
| #### Use PureComponent | ||
| #### 使用 PureComponent | ||
|
|
||
| In the above example, `DumbComponent` is a pure function of its props. That is, the component only needs to re-render when its props change. React has a special type of component built-in called `PureComponent` that is meant for exactly this use case. | ||
| 在上面的例子中,`DumbComponent` 是只接收属性的纯函数。这样,组件就只有当它的 props 变化的时候才重新渲染。React 有一个特殊的内置组件类型叫做 `PureComponent`,就是适用这种情况的用例。 | ||
|
|
||
| Instead of inheriting from React.Component, use React.PureComponent like this: | ||
| 与继承自 React.Component 相反,像这样使用 React.PureComponent: | ||
|
|
||
| class DumbComponent extends PureComponent { | ||
| render() { | ||
| return <div> {this.props.value} </div>; | ||
| } | ||
| } | ||
|
|
||
| Then, the component will only re-render when its props actually change. That’s it! | ||
| 那么只有当这个组件的 props 实际发生变化时它才会被重新渲染了。就是这样! | ||
|
|
||
| Note that `PureComponent` does a shallow comparison of props, so if you use complex data structures, it may miss some prop changes and not update your components. | ||
| 注意 `PureComponent` 对 props 做了一个浅对比,因此如果你使用复杂的数据结构,它可能会错失一些属性变化而不会更新你的组件。 | ||
|
|
||
| #### Implement shouldComponentUpdate | ||
| #### 调用 shouldComponentUpdate | ||
|
|
||
| `shouldComponentUpdate` is a component method called before `render` when either `props` or `state` has changed. If `shouldComponentUpdate` returns true, `render` will be called, if it returns false, nothing happens. | ||
| `shouldComponentUpdate` 是一个在 `render` 之前 `props` 或 `state` 发生改变时被调用的组件方法。如果 `shouldComponentUpdate` 返回 true,`render` 将会被调用,如果返回 false 什么也不会发生。 | ||
|
|
||
| By implementing this method, you can instruct React to avoid re-rendering a given component if its props don’t change. | ||
| 通过执行这个方法,你可以命令 React 在 props 没有发生改变的时候避免给定组件的重新渲染。 | ||
|
|
||
| For example, we could implement `shouldComponentUpdate` in our dumb component from above like this: | ||
| 例如,我们可以在上文中的 DumbComponent 中这样调用 `shouldComponentUpdate`。 | ||
|
|
||
| class DumbComponent extends Component { | ||
| shouldComponentUpdate(nextProps) { | ||
|
|
@@ -172,22 +172,23 @@ For example, we could implement `shouldComponentUpdate` in our dumb component fr | |
| } | ||
| } | ||
|
|
||
| ### Debugging Performance Issues in Production | ||
| ### 在生产环境中调试性能问题 | ||
|
|
||
| The React Developer Tools only work if you are running your app on your own machine. If you’re interested in understanding performance issues that users see in production, try [LogRocket](https://logrocket.com). | ||
| React Developer Tools 只能在你自己的机器上运行的应用中使用。如果您有兴趣了解用户在生产中看到的性能问题,试试 [LogRocket](https://logrocket.com)。 | ||
|
|
||
|  | ||
|
|
||
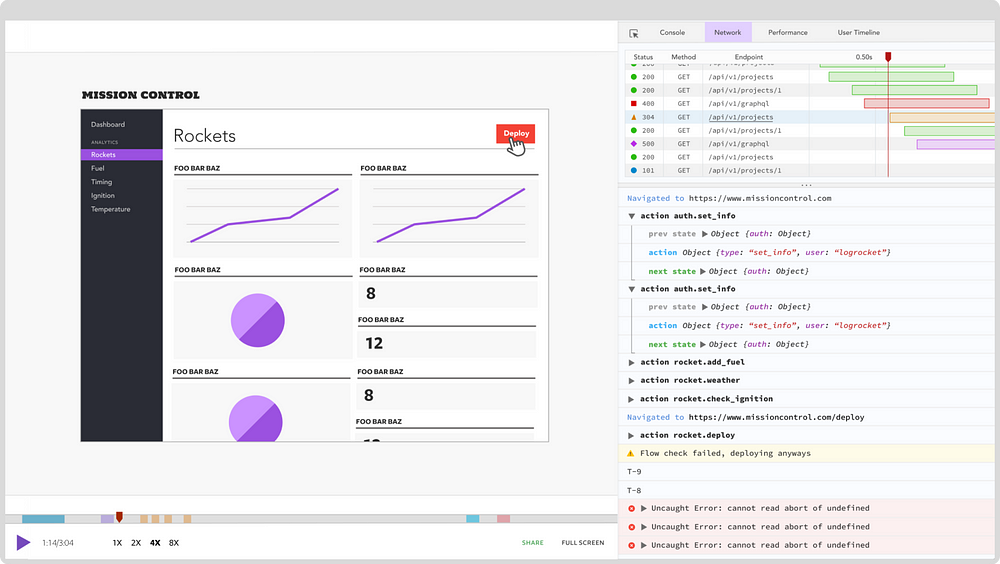
| [LogRocket](https://logrocket.com) is like a DVR for web apps, recording *literally**everything* that happens on your site. Instead of guessing why problems happen, you can replay sessions with bugs or performance issues to quickly understand the root cause. | ||
| [LogRocket](https://logrocket.com) 就像是 web 应用的 DVR,会记录发生在你的站点上的**所有的一切**。你可以重现带有 bug 或性能问题的会话来快速了解问题的根源,而不用猜测问题发生的原因。 | ||
|
|
||
| LogRocket instruments your app to record performance data, Redux actions/state, logs, errors, network requests/responses with headers + bodies, and browser metadata. It also records the HTML and CSS on the page, recreating pixel-perfect videos of even the most complex single-page apps. | ||
| LogRocket 工具为你的应用记录性能数据、Redux actions/state、日志、带有请求头和请求体的网络请求和响应以及浏览器的元数据。它也能记录页面上的 HTML 和 CSS,甚至可以为最复杂的单页面应用重新创建完美像素的视频。 | ||
|
|
||
| [**LogRocket | Logging and Session Replay for JavaScript Apps** | ||
| *LogRocket helps you understand problems affecting your users, so that you can get back to building great software.*logrocket.com](https://logrocket.com/) | ||
| [**LogRocket | 为 JavaScript 应用而生的日志记录和会话回放工具** | ||
| LogRocket 帮助你了解用影响你用户的问题,这样你就可以回过头来构建伟大的软件了。 | ||
| logrocket.com](https://logrocket.com/) | ||
|
|
||
| --- | ||
|
|
||
| Thanks for reading. I hope these tools and techniques help in your next React project! | ||
| 感谢阅读,希望这些工具和技术能在你的下一个 React 项目中帮到你! | ||
|
|
||
|
|
||
| --- | ||
|
|
||
Add this suggestion to a batch that can be applied as a single commit.
This suggestion is invalid because no changes were made to the code.
Suggestions cannot be applied while the pull request is closed.
Suggestions cannot be applied while viewing a subset of changes.
Only one suggestion per line can be applied in a batch.
Add this suggestion to a batch that can be applied as a single commit.
Applying suggestions on deleted lines is not supported.
You must change the existing code in this line in order to create a valid suggestion.
Outdated suggestions cannot be applied.
This suggestion has been applied or marked resolved.
Suggestions cannot be applied from pending reviews.
Suggestions cannot be applied on multi-line comments.
Suggestions cannot be applied while the pull request is queued to merge.
Suggestion cannot be applied right now. Please check back later.

There was a problem hiding this comment.
Choose a reason for hiding this comment
The reason will be displayed to describe this comment to others. Learn more.
『声命周期』=>『生命周期』