Use LiteScope To Debug A SoC
When developing a new core/interface or bringing up a new system composed of various cores, things are often not behaving as expected... This could be due to various reasons like a bug in a core, a miss interpretation of a specification, difference in interpretation between developers, etc...
To understand why the design is not behaving correctly, the internal signals of the FPGA need to be observed, in a similar way signals are observed during simulation to help/assist design.
The difference between hardware and simulation is that on hardware the signals have to be captured in real time, without perturbing the system, and with the limited resources available in the FPGA.
LiteScope is a small footprint and configurable embedded FPGA logic analyzer that has been developed for that purpose and we'll explain in the following sections how to integrate it in the SoC and how to use it.
With LiteScope, we want to capture internal signals of our design, store their values in an embedded memory of the FPGA and upload these datas to a Host PC to visualize them and debug/understand the issue.
To use LiteScope in LiteX, the first step is then to add a bridge connection between the Host PC and our FPGA board to allow the Host PC to access the main bus of our SoC and interact with it.
LiteX provides native bridges that can operate over a UART, Ethernet or PCIe and the integration of these bridges in the SoC is explained in the Use a Host Bridge to control/debug a SoC documentation.
Alternative ways to create a bridges have also been developed, such as USB/SPI (used on Fomu), SPI. #FIXME: add more infos.
Let's say we have a CPU in our design and want to be able to visualize the Wishbone accesses of the Instruction and Data buses, the first thing we do is creating the list of Migen signals we want to be observe:
analyzer_signals = [
    # IBus (could also just added as self.cpu.ibus)
    self.cpu.ibus.stb,
    self.cpu.ibus.cyc,
    self.cpu.ibus.adr,
    self.cpu.ibus.we,
    self.cpu.ibus.ack,
    self.cpu.ibus.sel,
    self.cpu.ibus.dat_w,
    self.cpu.ibus.dat_r,

    # DBus (could also just added as self.cpu.dbus)
    self.cpu.dbus.stb,
    self.cpu.dbus.cyc,
    self.cpu.dbus.adr,
    self.cpu.dbus.we,
    self.cpu.dbus.ack,
    self.cpu.dbus.sel,
    self.cpu.dbus.dat_w,
    self.cpu.dbus.dat_r,
]
Then we create the Litescope Analyzer that will be able to capture these signals:
from litescope import LiteScopeAnalyzer
self.submodules.analyzer = LiteScopeAnalyzer(analyzer_signals,
    depth        = 512,
    clock_domain = "sys",
    samplerate   = sys_clk_freq,
    csr_csv      = "analyzer.csv"
)
The Analyzer is configured with a depth of 512 samples, doing the capture in the sys clock domain of the SoC and exporting the its configuration (csr_csv) to analyzer.csv file that will be used by the software during the trigger/capture.
Note: Since samples are stored in embedded block rams of the FPGA, the depth will be limited by the number of available block rams in your design/FPGA. The total number of bits used for the capture is len(analyzer_signals)*depth.
Note: LiteScope also accepts Migen's Records, so in our example we could just have used:
analyzer_signals = [self.cpu.ibus, self.cpu.dbus]but it would have been less understandable.
We can now build our SoC and start using the Analyzer!
Now that the SoC is instrumented and built, we can start using the analyzer. The first step is to run the LiteX server on the Host to allow communicating with the SoC and execute scripts. The previous example is integrated in LiteX Sim and we are going to use it here.
The simulation can be run with litex_sim --with-etherbone --with-analyzer and the LiteX server started with litex_server --udp --udp-ip=192.168.1.51.
To do our captures, we'll first use litescope_cli that is directly installed with LiteScope.
Let's just do a first immediate capture of the internals signals:
$litescope_cli
No trigger, immediate capture.
[running]...
[uploading]...
[====================>] 100%
[writing to dump.vcd]...
Note:
litescope_cliwill by default use a localanalyzer.csvAnalyzer description file (File generated by Litescope during design elaboration). You can point to another description file with the--csvargument.
And open it with GTKWave:

... OK, nothing really interesting here since that was just an immediate capture but this gives us an easy way to look at the current status of the internal signals, we just see that there is some activity on the Data Bus and nothing on the Instruction Bus.
Now let's try triggering on a specific event, to get the list of signals that can be used as trigger the --list argument can be used:
$litescope_cli --list
soc_simsoc_cpu_ibus_stb
soc_simsoc_cpu_ibus_cyc
soc_simsoc_cpu_ibus_adr
soc_simsoc_cpu_ibus_we
soc_simsoc_cpu_ibus_ack
soc_simsoc_cpu_ibus_sel
soc_simsoc_cpu_ibus_dat_w
soc_simsoc_cpu_ibus_dat_r
soc_simsoc_cpu_dbus_stb
soc_simsoc_cpu_dbus_cyc
soc_simsoc_cpu_dbus_adr
soc_simsoc_cpu_dbus_we
soc_simsoc_cpu_dbus_ack
soc_simsoc_cpu_dbus_sel
soc_simsoc_cpu_dbus_dat_w
soc_simsoc_cpu_dbus_dat_r
The LiteX simulation is running and we are able to interact with the BIOS, let's configure the analyzer to trigger on ibus_stbrising edge and press enter, this will cause the CPU to fetch some data on the instruction bus and should trigger the capture:
$litescope_cli -r soc_simsoc_cpu_ibus_stb
Exact: soc_simsoc_cpu_ibus_stb
Rising edge: soc_simsoc_cpu_ibus_stb
[running]...
The trigger condition has been configured and the analyzer is now waiting for trigger condition to happen, let's press Enter in the BIOS console:

[uploading]...
[====================>] 100%
[writing to dump.vcd]...
The trigger condition has been found and litescope_cli is now uploading capture data to the Host to generate our dump.

We effectively see that the capture occurred ibus_stb's rising edge.
We'll now trigger on a specific bus value: we can try to use mem_write command of the BIOS to write a specific value to the RAM and try to trigger on this specific write:
Let's say we want to trig on ibus_dat_w = 0x12345678:
litescope_cli -v soc_simsoc_cpu_dbus_dat_w 0x12345678
Condition: soc_simsoc_cpu_dbus_dat_w == 0x12345678
[running]...
We then write 0x5aa55aa5 to 0x40000000:

Nothing happening on litescope_cli, as expected...
Now let's write: 0x12345678 to 0x40000000:

Now it's triggering:
[uploading]...
[====================>] 100%
[writing to dump.vcd]...
And we effectively see that the capture occured on the configured trigger:
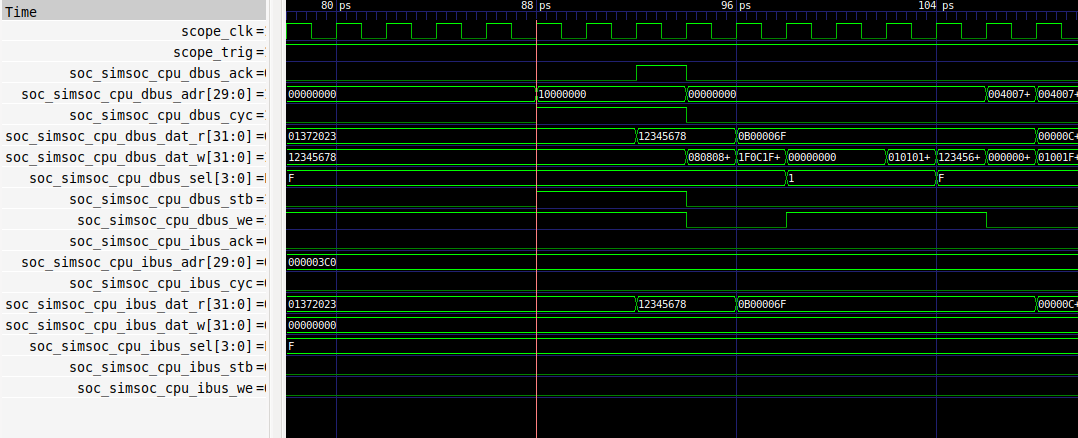
With our previous trigger we were only checking the data bus value, if we also want to check the address we can use:
litescope_cli -v soc_simsoc_cpu_dbus_dat_w 0x12345678 -v soc_simsoc_cpu_dbus_adr 0x10000000It's also possible to ignore a part of the value with x:
litescope_cli -v soc_simsoc_cpu_dbus_dat_w 0x123456xxThat will ignore the last byte and so will trig for any 0x123456xx value.
To get the full list of supported triggers/features of litescope_cli you can use --help:
litescope_cli --help
usage: litescope_cli [-h] [-r RISING_EDGE] [-f FALLING_EDGE]
                     [-v TRIGGER VALUE] [-l] [--csv CSV] [--group GROUP]
                     [--subsampling SUBSAMPLING] [--offset OFFSET]
                     [--length LENGTH] [--dump DUMP]

LiteScope Client utility

optional arguments:
  -h, --help            show this help message and exit
  -r RISING_EDGE, --rising-edge RISING_EDGE
                        Add rising edge trigger
  -f FALLING_EDGE, --falling-edge FALLING_EDGE
                        Add falling edge trigger
  -v TRIGGER VALUE, --value-trigger TRIGGER VALUE
                        Add conditional trigger with given value
  -l, --list            List signal choices
  --csv CSV             Analyzer CSV file
  --group GROUP         Capture Group
  --subsampling SUBSAMPLING
                        Capture Subsampling
  --offset OFFSET       Capture Offset
  --length LENGTH       Capture Length
--dump DUMP Capture FilenameUsing litescope_cli is recommended and should cover most of the use cases. It is however possible to also use custom scripts to control the analyzer and do the triggering with it.
To analyze the instruction bus of the CPU, we create the following litescope_analyzer.py script:
#!/usr/bin/env python3

import sys
import argparse

from litex import RemoteClient
from litescope import LiteScopeAnalyzerDriver

parser = argparse.ArgumentParser()
parser.add_argument("--ibus_stb",  action="store_true", help="Trigger on IBus Stb rising edge.")
parser.add_argument("--ibus_adr",  default=0x00000000,  help="Trigger on IBus Adr value.")
parser.add_argument("--offset",    default=128,         help="Capture Offset.")
parser.add_argument("--length",    default=512,         help="Capture Length.")
args = parser.parse_args()

wb = RemoteClient()
wb.open()

# # #

analyzer = LiteScopeAnalyzerDriver(wb.regs, "analyzer", debug=True)
analyzer.configure_group(0)
if args.ibus_stb:
	analyzer.add_rising_edge_trigger("simsoc_cpu_ibus_stb")
elif args.ibus_adr:
    analyzer.configure_trigger(cond={"simsoc_cpu_ibus_adr": int(args.ibus_adr, 0)})
else:
    analyzer.configure_trigger(cond={})
analyzer.run(offset=int(args.offset), length=int(args.length))

analyzer.wait_done()
analyzer.upload()
analyzer.save("dump.vcd")

# # #

wb.close()
This script will allow us to trigger on a ibus_stb rising edge or on a specific ibus_adr value.
The LiteX simulation is running and we are able to interact with the BIOS, let's configure the analyzer to trigger on ibus_stbrising edge and press enter, this will cause the CPU to fetch some data on the instruction bus and will trigger the capture:
$./litescope_analyzer.py --ibus_stb
[running]...
[uploading]...
|====================>| 100%
[writing to dump.vcd]...
We can then open the wave with GTKWave and analyze the access:

Now let's trigger on ibus_adr=0x00000000 (which is the reset address of the CPU) and run the reboot command of the BIOS:

$./litescope_analyzer.py --ibus_adr=0x00000000
[running]...
[uploading]...
|====================>| 100%
[writing to dump.vcd]...
We can then open the wave with GTKWave and analyze the access:
